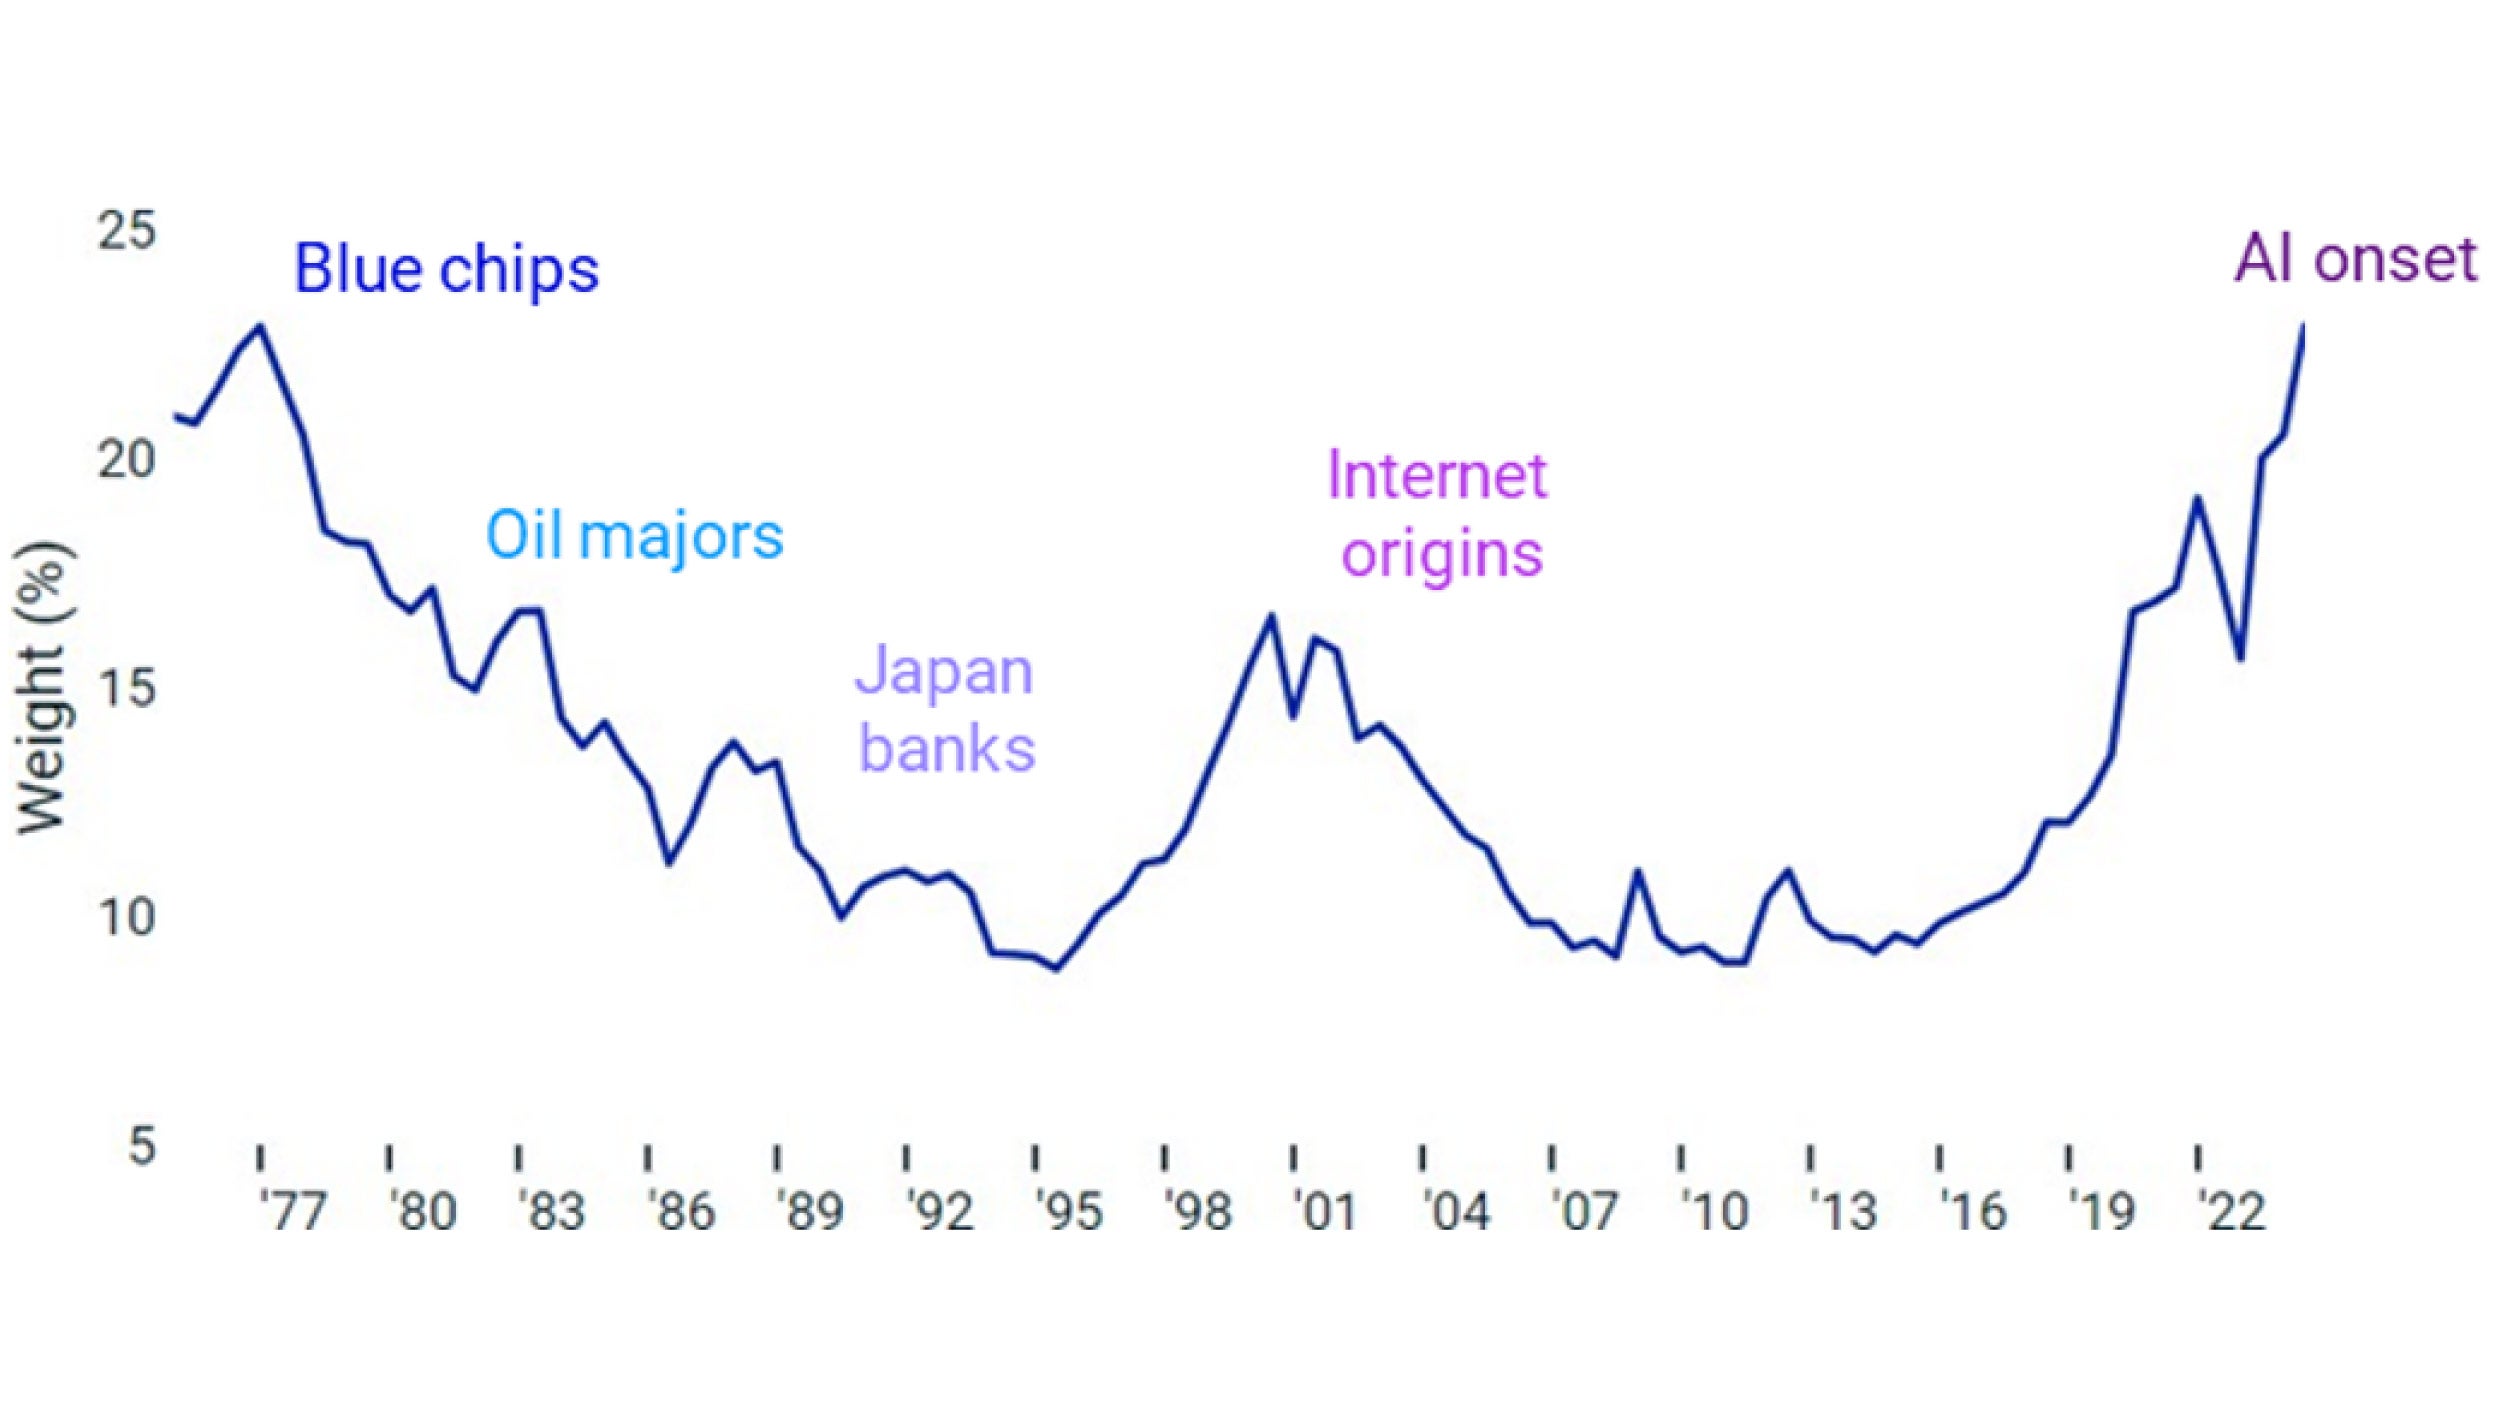
The concentrated weight of the top 10 stocks in the MSCI World index is at the highest level for more than 40 years. The above chart also highlights that the types of stocks driving the market – and making up the top 10 – often changed during this time. Many investors will remember the dot.com era, both the hype in the late ‘90s to the bursting of that bubble in the early 2000s.
Combating this concentration risk is where an equal-weight approach can provide a simple solution. These indices will include the same stocks as their market-cap weighted equivalents, but, as you have probably guessed, will attribute the same weighting to each company regardless of their size. An equal weight index will be rebalanced on a regular schedule, e.g., quarterly for MSCI World. During this exercise, stocks that have outperformed the index are reduced and those that underperformed are increased, so that all stocks in the index again have the same weight.
An equal-weighted approach to MSCI World
The MSCI World Index includes more than 1,400 stocks across 23 developed markets. The largest single constituent accounts for 4.8% of the standard market-cap-weighted index versus 0.07% of the equal weight version (after each of the quarterly rebalances). Conversely, equal weight investors gain more exposure to smaller stocks, which often have different growth drivers than the mega-cap names at the top of the standard index. The smallest stock in MSCI World has only 0.003% weight but 0.07% of the equal weight version (the same as every other stock).
The difference in geographical exposures is also worth noting. While the US comprises over 70% of the standard index, it’s only around 40% of the equal-weight variant. Japan receives the largest uplift with an allocation of around 15% compared to 5.8% in the standard index. In fact, investors gain more exposure to all other markets through an equal weight approach.


