Product Details
The Invesco S&P SmallCap Quality ETF (Fund) is based on the S&P SmallCap 600® Quality Index (Index). The Fund will invest at least 90% of its total assets in securities that comprise the Index. The Index is composed of 120 securities in the S&P SmallCap 600® Index that have the highest quality score, which is calculated based on the average of three fundamental measures: return on equity, accruals ratio and financial leverage ratio. The Fund and the Index are rebalanced and reconstituted semi-annually on the third Friday of June and December.
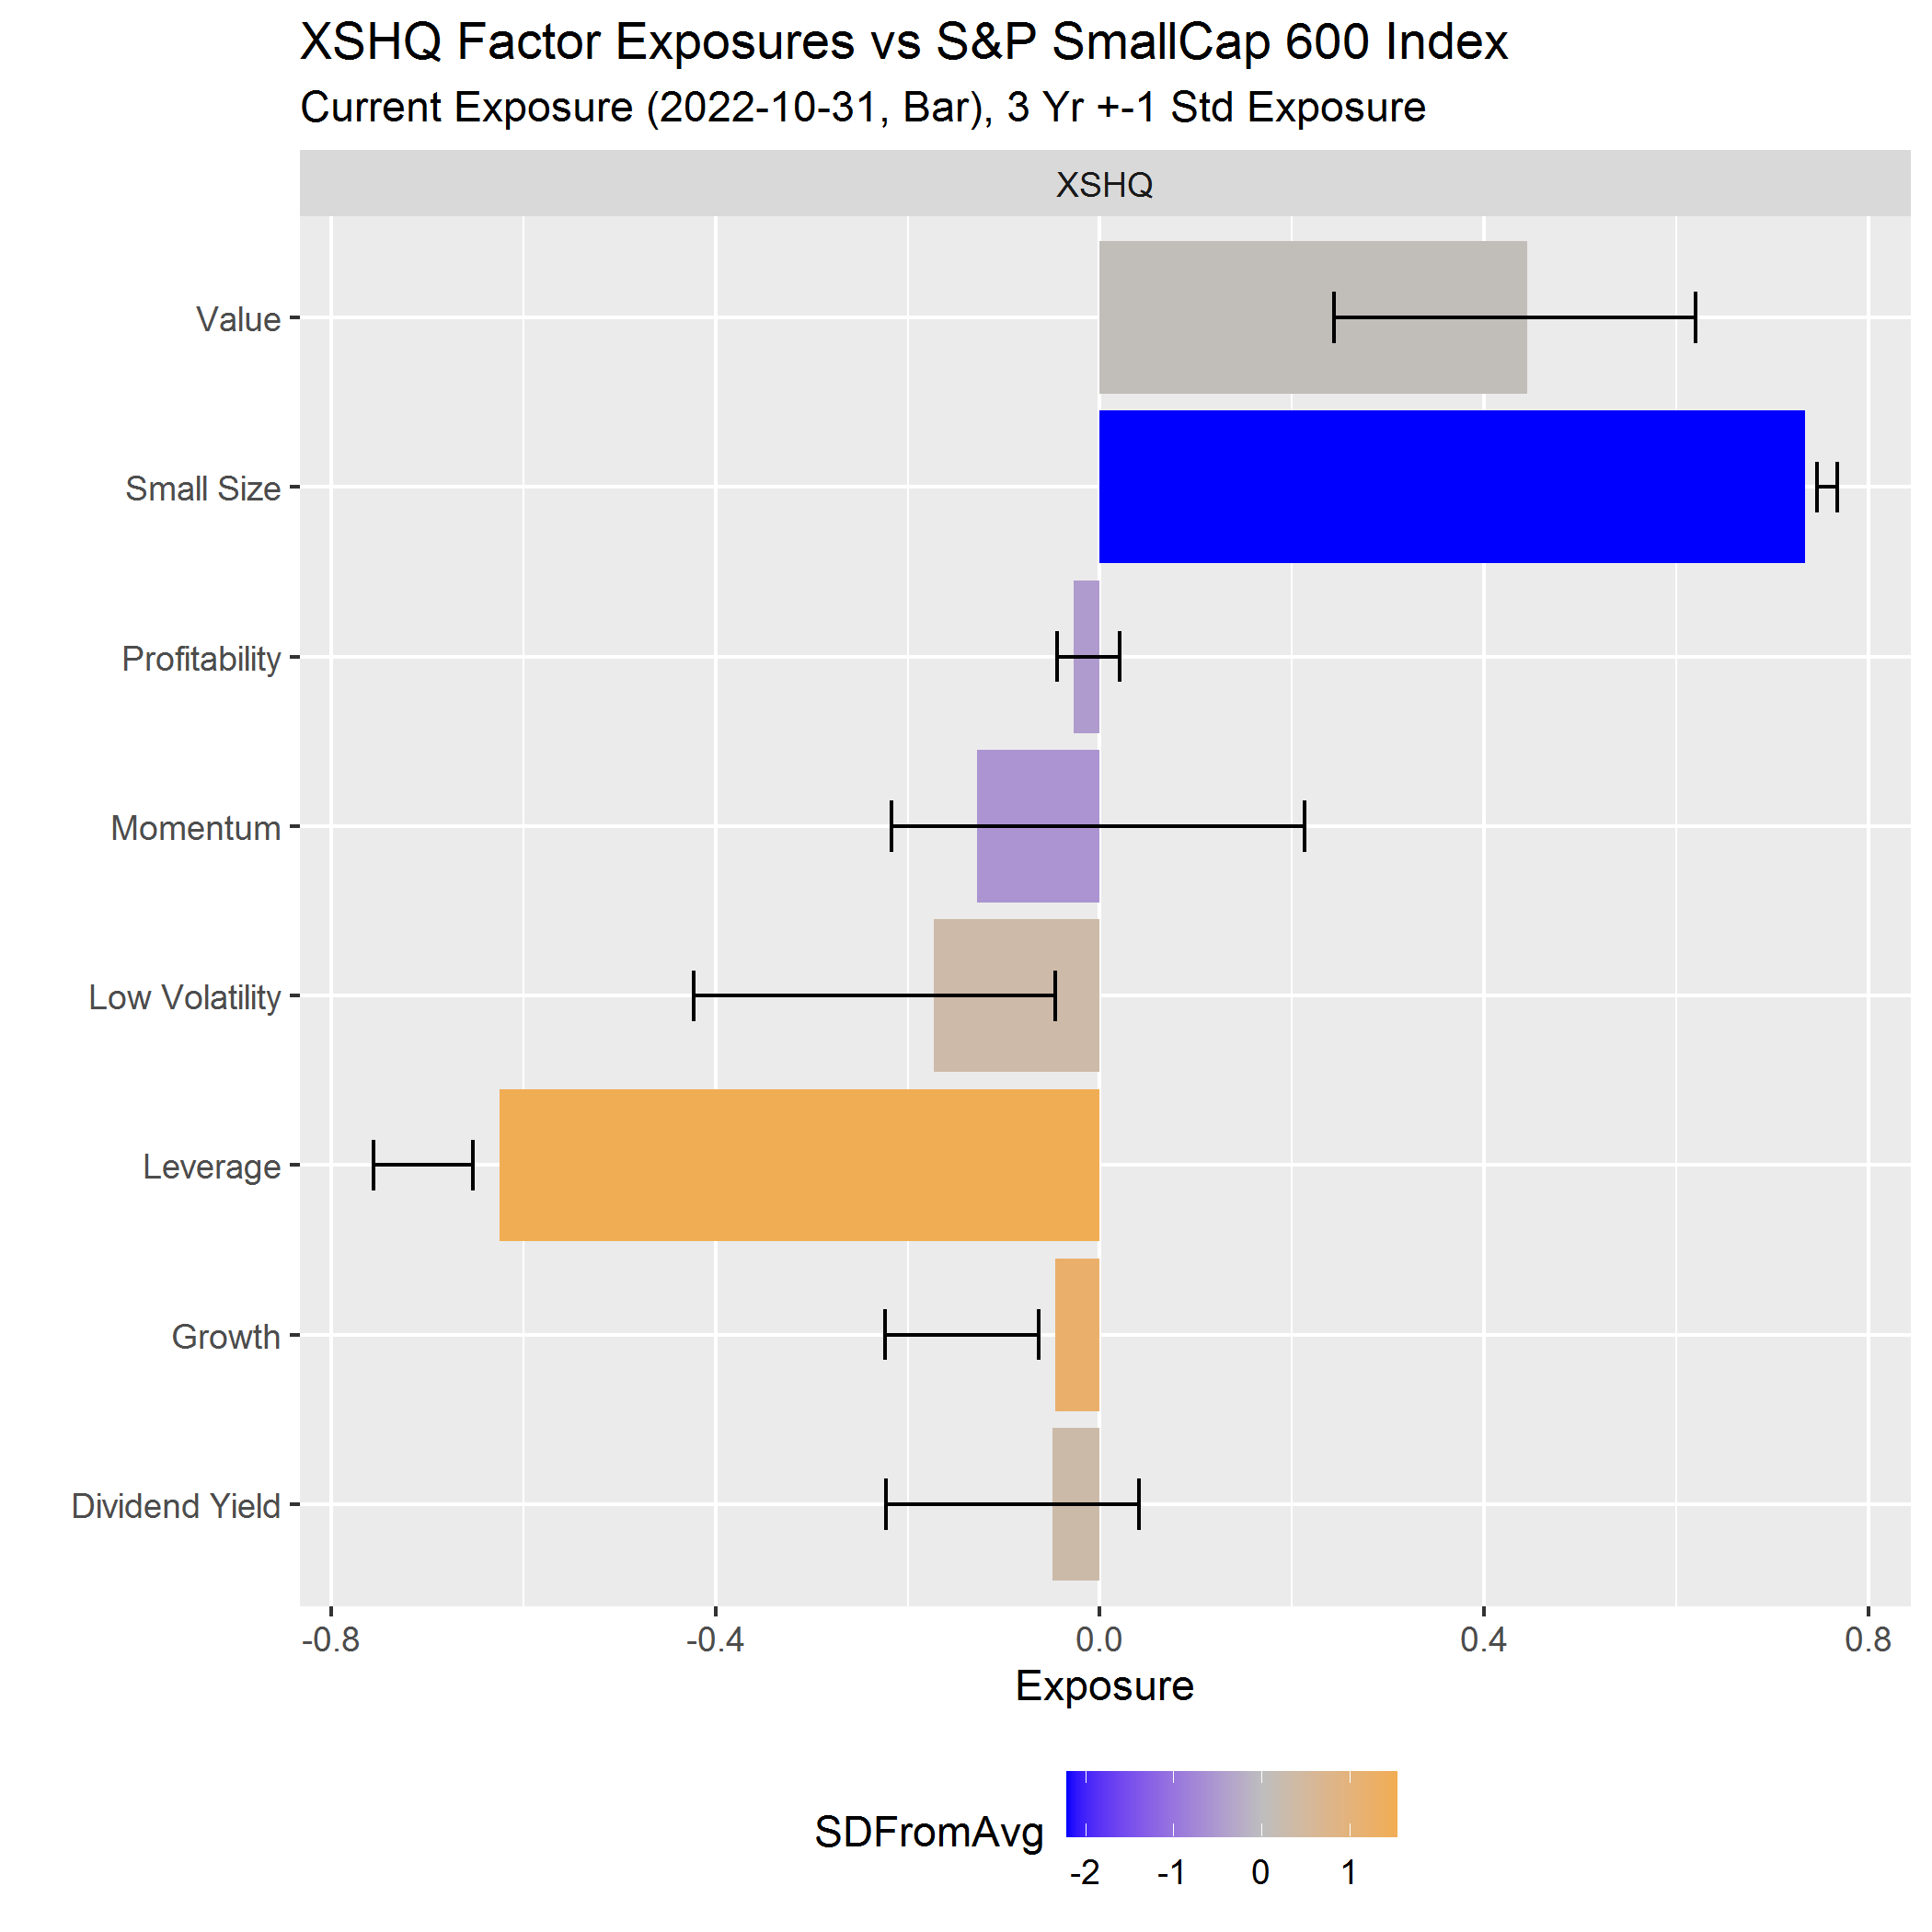
Factor DNATM
Financial Professionals - Log in to view the fund’s Factor DNATM chart
Source: Axioma, Inc.
Factor score methodology
Axioma is used to calculate the data that goes into the charts. We use Axioma's global short time horizon risk model.
The current factor exposures of the ETF relative to its benchmark index are shown using the bars in the chart. Each factor's band indicates the +/- one standard deviation exposure of the fund to that factor over the past three years.
The bar color is determined by comparing the number of standard deviations the current exposure is from the average three-year exposure. Higher exposures are a bright color, while lower exposures are a dark color.
See notes below for factor definitions.
Value: Book to price; Small size: Natural log of the total issuer market capitalization average over the last month. Companies with a smaller market cap receive a higher score; Profitability: considers return-on-equity, return-on-assets, cash-flow-to-assets, cash-flow-to-income, gross margin and sales-to-assets; Momentum: cumulative return over last 20 days; Low Volatility: square root of 60-day average of absolute return / cross sectional market volatility. Lower volatility stocks receive a higher score; Leverage: equal weight average of debt-to-assets and debt-to-equity; Growth: equal weight average of earnings growth rate and the sales growth rate; Dividend Yield: trailing 12-month dividend yield.
Factor DNATM
Financial Professionals - Log in to view the fund’s Factor DNATM chart
Factor score methodology
Axioma is used to calculate the data that goes into the charts. We use Axioma's global short time horizon risk model.
The current factor exposures of the ETF relative to its benchmark index are shown using the bars in the chart. Each factor's band indicates the +/- one standard deviation exposure of the fund to that factor over the past three years.
The bar color is determined by comparing the number of standard deviations the current exposure is from the average three-year exposure. Higher exposures are a bright color, while lower exposures are a dark color.
See notes below for factor definitions.
Value: Book to price; Small size: Natural log of the total issuer market capitalization average over the last month. Companies with a smaller market cap receive a higher score; Profitability: considers return-on-equity, return-on-assets, cash-flow-to-assets, cash-flow-to-income, gross margin and sales-to-assets; Momentum: cumulative return over last 20 days; Low Volatility: square root of 60-day average of absolute return / cross sectional market volatility. Lower volatility stocks receive a higher score; Leverage: equal weight average of debt-to-assets and debt-to-equity; Growth: equal weight average of earnings growth rate and the sales growth rate; Dividend Yield: trailing 12-month dividend yield.
Morningstar Rating ™
Overall Rating - Small Blend CategoryAs of 03/31/2024 the Fund had an overall rating of 4 stars out of 584 funds and was rated 4 stars out of 584 funds, 4 stars out of 552 funds and N/A stars out of N/A funds for the 3-, 5- and 10- year periods, respectively.
Source: Morningstar Inc. Ratings are based on a risk-adjusted return measure that accounts for variation in a fund's monthly performance, placing more emphasis on downward variations and rewarding consistent performance. Open-end mutual funds and exchange-traded funds are considered a single population for comparison purposes. Ratings are calculated for funds with at least a three year history. The overall rating is derived from a weighted average of three-, five- and 10-year rating metrics, as applicable, excluding sales charges and including fees and expenses. ©2024 Morningstar Inc. All rights reserved. The information contained herein is proprietary to Morningstar and/or its content providers. It may not be copied or distributed and is not warranted to be accurate, complete or timely. Neither Morningstar nor its content providers are responsible for any damages or losses arising from any use of this information. Past performance does not guarantee future results. The top 10% of funds in a category receive five stars, the next 22.5% four stars, the next 35% three stars, the next 22.5% two stars and the bottom 10% one star. Ratings are subject to change monthly. Had fees not been waived and/or expenses reimbursed currently or in the past, the Morningstar rating would have been lower. Ratings for other share classes may differ due to different performance characteristics.
Performance
| Index History (%) | YTD | 1Yr | 3Yr | 5Yr | 10Yr | Since Inception |
|---|---|---|---|---|---|---|
| S&P SmallCap 600 Quality Index | 3.79 | 23.63 | 5.81 | 11.04 | N/A | 9.64 |
| S&P SmallCap 600 Index | 2.46 | 15.93 | 2.28 | 9.15 | 8.80 | 8.84 |
| Fund History (%) | ||||||
| Fund NAV | 3.73 | 23.27 | 5.50 | 10.68 | N/A | 9.27 |
| After Tax Held | 3.60 | 22.83 | 5.07 | 10.23 | N/A | 8.88 |
| After Tax Sold | 2.20 | 13.91 | 4.15 | 8.35 | N/A | 7.34 |
| Fund Market Price | 3.63 | 23.24 | 5.43 | 10.64 | N/A | 9.28 |
Market returns are based on the midpoint of the bid/ask spread at 4 p.m. ET and do not represent the returns an investor would receive if shares were traded at other times. Performance data quoted represents past performance, which is not a guarantee of future results. Investment returns and principal value will fluctuate, and shares, when redeemed, may be worth more or less than their original cost. Current performance may be higher or lower than performance data quoted. After-tax returns reflect the highest federal income tax rate but exclude state and local taxes. Fund performance reflects applicable fee waivers, absent which, performance data quoted would have been lower. After Tax Held and After Tax Sold are based on NAV. Returns less than one year are cumulative.
Growth of $10,000
Data beginning 10 years prior to the ending date of 03/31/2024. Fund performance shown at NAV.
S&P 500 High Quality Rankings Index* performance prior to 6/30/2010 reflects that of the original Underlying Index Value Line Timeliness Select Index. From 6/30/2010 to 3/18/2016, Index performance reflects that of the previous Underlying Index, S&P 500 High Quality Rankings Index. From 3/18/2016 forward, the Index performance reflects that of the Underlying Index, S&P 500 Quality Index AND IS NOT INTENDED FOR ANY THIRD PARTY USE.
An investor cannot invest directly in an index. The results assume that no cash was added to or assets withdrawn from the Index. Index returns do not represent Fund returns. The Index does not charge management fees or brokerage expenses, nor does the Index lend securities, and no revenues from securities lending were added to the performance shown.
Sector Allocation
| Sector | Percent of Fund |
|---|---|
| Industrials | 21.31% |
| Financials | 17.53% |
| Consumer Discretionary | 17.04% |
| Energy | 13.88% |
| Information Technology | 10.32% |
| Materials | 6.97% |
| Consumer Staples | 5.00% |
| Health Care | 4.31% |
| Communication Services | 2.33% |
| Utilities | 1.29% |
| Investment Companies | 0.02% |
| Cash | 0.00% |
Market Cap & Style Allocations
| Large-Cap Value | - |
| Large-Cap Blend | - |
| Large-Cap Growth | - |
| Mid-Cap Value | - |
| Mid-Cap Blend | 2.69% |
| Mid-Cap Growth | - |
| Small-Cap Value | 28.25% |
| Small-Cap Blend | 48.42% |
| Small-Cap Growth | 20.64% |
as of 04/18/2024 Top Holdings | View All
Fund Holdings subject to change
| Ticker | Company | % of Fund |
|---|---|---|
| MLI | Mueller Industries Inc | 2.54 |
| SM | SM Energy Co | 2.35 |
| BMI | Badger Meter Inc | 2.23 |
| APAM | Artisan Partners Asset Management Inc | 2.17 |
| AMR | Alpha Metallurgical Resources Inc | 2.13 |
| IBP | Installed Building Products Inc | 2.13 |
| AAON | AAON Inc | 1.97 |
| ABG | Asbury Automotive Group Inc | 1.91 |
| WIRE | Encore Wire Corp | 1.80 |
| WDFC | WD-40 Co | 1.69 |
Distributions | Hide View All | Distribution Information
| Ex-Date | Record Date | Pay Date | $/ Share |
Ordinary Income | Short Term Gains | Long Term Gains | Return of Capital | Liquidation Distribution |
|---|---|---|---|---|---|---|---|---|
| 03/18/2024 | 03/19/2024 | 03/22/2024 | 0.11887 | 0.11887 | - | - | - | - |
| 12/18/2023 | 12/19/2023 | 12/22/2023 | 0.10931 | 0.10931 | - | - | - | - |
| 09/18/2023 | 09/19/2023 | 09/22/2023 | 0.10614 | 0.10614 | - | - | - | - |
| 06/20/2023 | 06/21/2023 | 06/23/2023 | 0.12582 | 0.12582 | - | - | - | - |
| 03/20/2023 | 03/21/2023 | 03/24/2023 | 0.11908 | 0.11908 | - | - | - | - |
| 12/19/2022 | 12/20/2022 | 12/23/2022 | 0.20813 | 0.20813 | - | - | - | - |
| 09/19/2022 | 09/20/2022 | 09/23/2022 | 0.12452 | 0.12452 | - | - | - | - |
| 06/21/2022 | 06/22/2022 | 06/30/2022 | 0.16632 | 0.16632 | - | - | - | - |
| 03/21/2022 | 03/22/2022 | 03/31/2022 | 0.15862 | 0.15862 | - | - | - | - |
| 12/20/2021 | 12/21/2021 | 12/31/2021 | 0.24784 | 0.24784 | - | - | - | - |
| 09/20/2021 | 09/21/2021 | 09/30/2021 | 0.11638 | 0.11638 | - | - | - | - |
| 06/21/2021 | 06/22/2021 | 06/30/2021 | 0.07000 | 0.07000 | - | - | - | - |
| 03/22/2021 | 03/23/2021 | 03/31/2021 | 0.05659 | 0.05659 | - | - | - | - |
| 12/21/2020 | 12/22/2020 | 12/31/2020 | 0.09087 | 0.09087 | - | - | - | - |
| 09/21/2020 | 09/22/2020 | 09/30/2020 | 0.12158 | 0.12158 | - | - | - | - |
| 06/22/2020 | 06/23/2020 | 06/30/2020 | 0.05655 | 0.05655 | - | - | - | - |
| 03/23/2020 | 03/24/2020 | 03/31/2020 | 0.12838 | 0.12838 | - | - | - | - |
| 12/23/2019 | 12/24/2019 | 12/31/2019 | 0.13333 | 0.13333 | - | - | - | - |
| 09/23/2019 | 09/24/2019 | 09/30/2019 | 0.03421 | 0.03421 | - | - | - | - |
| 06/24/2019 | 06/25/2019 | 06/28/2019 | 0.09270 | 0.09270 | - | - | - | - |
| 03/18/2019 | 03/19/2019 | 03/29/2019 | 0.06354 | 0.06354 | - | - | - | - |
| 12/26/2018 | 12/27/2018 | 12/31/2018 | - | - | 0.00486 | - | - | - |
| 12/24/2018 | 12/26/2018 | 12/31/2018 | 0.11590 | 0.11590 | - | - | - | - |
| 09/24/2018 | 09/25/2018 | 09/28/2018 | 0.06673 | 0.06673 | - | - | - | - |
| 06/18/2018 | 06/19/2018 | 06/29/2018 | 0.04409 | 0.04409 | - | - | - | - |
| 03/19/2018 | 03/20/2018 | 03/29/2018 | 0.05865 | 0.05865 | - | - | - | - |
| 12/18/2017 | 12/19/2017 | 12/29/2017 | 0.11569 | 0.11569 | - | - | - | - |
| 09/18/2017 | 09/19/2017 | 09/29/2017 | 0.04758 | 0.04758 | - | - | - | - |
| 06/16/2017 | 06/20/2017 | 06/30/2017 | 0.04855 | 0.04855 | - | - | - | - |
Distribution Information
Frequency Distribution of Discounts & Premiums
| Bid/Ask MidPoint Above NAV | |||||||
|---|---|---|---|---|---|---|---|
| Quarter Ending |
Days | 0.00- 0.25% |
0.26- 0.50% |
0.51- 0.99% |
1.00- 1.49% |
1.50- 1.99% |
≥2.00% |
| 03/31/2024 | 61 | 46 | 0 | 0 | 0 | 1 | 0 |
| 12/31/2023 | 63 | 60 | 0 | 0 | 0 | 0 | 0 |
| 09/30/2023 | 63 | 53 | 0 | 1 | 0 | 0 | 0 |
| 06/30/2023 | 62 | 33 | 2 | 1 | 0 | 0 | 0 |
| Year Ended 2023 | 250 | 192 | 3 | 2 | 0 | 0 | 0 |
| Bid/Ask Midpoint Below NAV | |||||||
|---|---|---|---|---|---|---|---|
| Quarter Ending |
Days | 0.00- 0.25% |
0.26- 0.50% |
0.51- 0.99% |
1.00- 1.49% |
1.50- 1.99% |
≥2.00% |
| 03/31/2024 | 61 | 12 | 0 | 0 | 2 | 0 | 0 |
| 12/31/2023 | 63 | 3 | 0 | 0 | 0 | 0 | 0 |
| 09/30/2023 | 63 | 9 | 0 | 0 | 0 | 0 | 0 |
| 06/30/2023 | 62 | 26 | 0 | 0 | 0 | 0 | 0 |
| Year Ended 2023 | 250 | 53 | 0 | 0 | 0 | 0 | 0 |
Fund Inception : 04/06/2017
Shareholders may pay more than net asset value when they buy Fund shares and receive less than net asset value when they sell those shares, because shares are bought and sold at current market prices. Performance data quoted represents past performance, which is not a guarantee of future results.
Shareholders may pay more than net asset value when they buy Fund shares and receive less than net asset value when they sell those shares, because shares are bought and sold at current market prices. Performance data quoted represents past performance, which is not a guarantee of future results.
Fund Documents
Risk & Other Information
Typically, security classifications used in calculating allocation tables are as of the last trading day of the previous month.
There are risks involved with investing in ETFs, including possible loss of money. Shares are not actively managed and are subject to risks similar to those of stocks, including those regarding short selling and margin maintenance requirements. Ordinary brokerage commissions apply. The Fund’s return may not match the return of the Underlying Index. The Fund is subject to certain other risks. Please see the current prospectus for more information regarding the risk associated with an investment in the Fund.
Stocks of small-capitalization companies tend to be more vulnerable to adverse developments, may be more volatile, and may be illiquid or restricted as to resale than large companies.
Investments focused in a particular sector, such as financials, are subject to greater risk, and are more greatly impacted by market volatility, than more diversified investments.
The Fund may become “non-diversified”, as defined under the Investment Company Act of 1940, as amended, solely as a result of a change in relative market capitalization or index weighting of one or more constitutes of the Index. Shareholder approval will not be sought when the Fund crosses from diversified to non-diversified status under such circumstances.
The Global Industry Classification Standard was developed by and is the exclusive property and a service mark of MSCI, Inc. and Standard & Poor's.
S&P® is a registered trademark of Standard & Poor's Financial Services LLC (S&P) and Dow Jones® is a registered trademark of Dow Jones Trademark Holdings LLC (Dow Jones). These trademarks have been licensed for use by S&P Dow Jones Indices LLC. S&P® and Standard & Poor's® are trademarks of S&P and Dow Jones® is a trademark of Dow Jones. These trademarks have been sublicensed for certain purposes by Invesco Capital Management LLC. The Index is a product of S&P Dow Jones Indices LLC and/or its affiliates and has been licensed for use by Invesco. The Fund is not sponsored, endorsed, sold or promoted by S&P Dow Jones Indices LLC, Dow Jones, S&P or their respective affiliates and neither S&P Dow Jones Indices LLC, Dow Jones, S&P or their respective affiliates make any representation regarding the advisability of investing in such product(s).
© 2021 Axioma, Inc. All Rights Reserved. The information, data, analyses and opinions (“Information”) contained herein: (1) include the proprietary information of Axioma; (2) may not be copied or redistributed except as specifically authorized; (3) do not constitute financial, investment, or legal advice; (4) are provided solely for informational purposes; and (5) are not warranted to be complete, accurate or timely. Axioma is not responsible for any trading decisions, damages or other losses related to the Information or its use. Information should be verified before use and should not be acted upon without first obtaining specific legal, tax, and investment advice from a licensed professional. Past performance is no guarantee of future results. The value and income derived from investments may go down as well as up.
 United States
 Canada (English)
 United Kingdom
 Isle of Man
 Jersey
 Guernsey
 Australia
 China
China Hong Kong
 Japan
Japan Taiwan
 Europe
 Dubai
Dubai