Uncommon truths: Private equity is from Mars; hedge funds are from Venus

András Vig, Multi-Asset Strategist with the Global Market Strategy Office, also contributed to the article.
We look at real estate, commodities, private equity, hedge funds, diamonds and fine wines, and see how they perform as core or tactical assets.
What role can alternative assets play in our model asset allocation framework? We look at real estate, commodities, private equity, hedge funds, diamonds and fine wines. We think some are core assets, others tactical while some have no role. We also examine how they have coped during 2020.
We are often asked for views on alternative assets, by which we guess people mean non-liquid assets that are usually beyond the reach of the average investor. Examples could include direct real estate investments, private equity and many hedge fund strategies (distressed assets, merger arbitrage etc.). Commodities may also fall into this category, given the difficulty of delivery and storage. Many such assets have now become more accessible (REITs, private equity funds, publicly traded hedge funds, commodity funds and certificates etc.) but many investors still consider them to be alternative.
There is, of course, another category of alternatives which can best be described as collectibles: real assets that are often collected for reasons other than financial gain. However, they often rise in price over the long term. Examples include, fine wines, rare stamps and coins, art, jewellery, baseball cards etc. Collectibles for the most part lack a liquid market and the worth of an asset is often judged by the most recent sale price of an equivalent asset.
For the purposes of this analysis we are primarily interested in what role hedge funds and private equity could play in our asset allocation framework, which already includes commodities. We also compare direct real estate with REITs. Finally, we look at those collectibles for which we have been able to find reasonable data: fine wines and diamonds.
Figure 1 puts some of those alternative assets into the risk-reward space that we use for traditional assets. Note that if we started the analysis one year earlier, the private equity bubble would be much higher (17.5% average annual return versus 9.1%) and further to the right (46.1% standard deviation versus 27.8%) due to the outsized 184% return in 1999. However, we think Figure 1 is a better representation of what we would expect from private equity over time (a bit more return than stocks but with more volatility).
Among other interesting features in Figure 1 is the fact that direct real estate seems to give lower returns than REITs, though with lower volatility and less correlation with other assets (the smaller the bubble, the less the correlation). This may be due to the fact we are comparing US direct real estate with global REITs but the comparison is even starker with US REITs, which produced higher returns than global REITs over the period considered, with similar volatility.
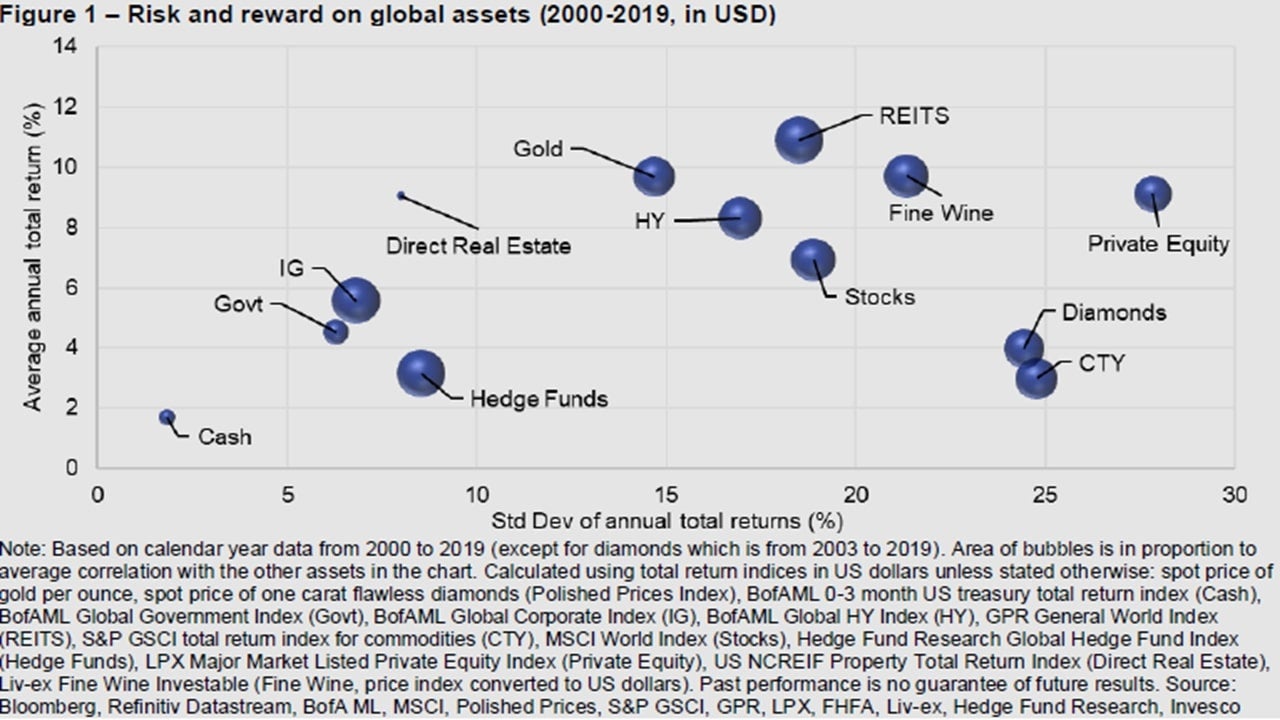
Interestingly, direct real estate would be close to the efficient frontier for the 2000-2019 period, suggesting it could play a role in optimal portfolios (note that REITs would be at one end of the efficient frontier, with cash at the other end).
It would also appear that gold would be close to the efficient frontier, though we suspect this is an outcome very specific to the period considered. The price of gold was below $300 at the start of 2000, which was close to a multi-decade low in real terms. It has since climbed to around $1700, which is well above the long-term historical average (since 1833) of around $600 (expressed in today’s prices). As shown in the 21st Century Portfolio, the positioning of gold within the risk-reward framework over the long-term is very similar to that of broad commodity indices (CTY) in Figure 1. Note that diamonds have produced a similar outcome to CTY since 2000.
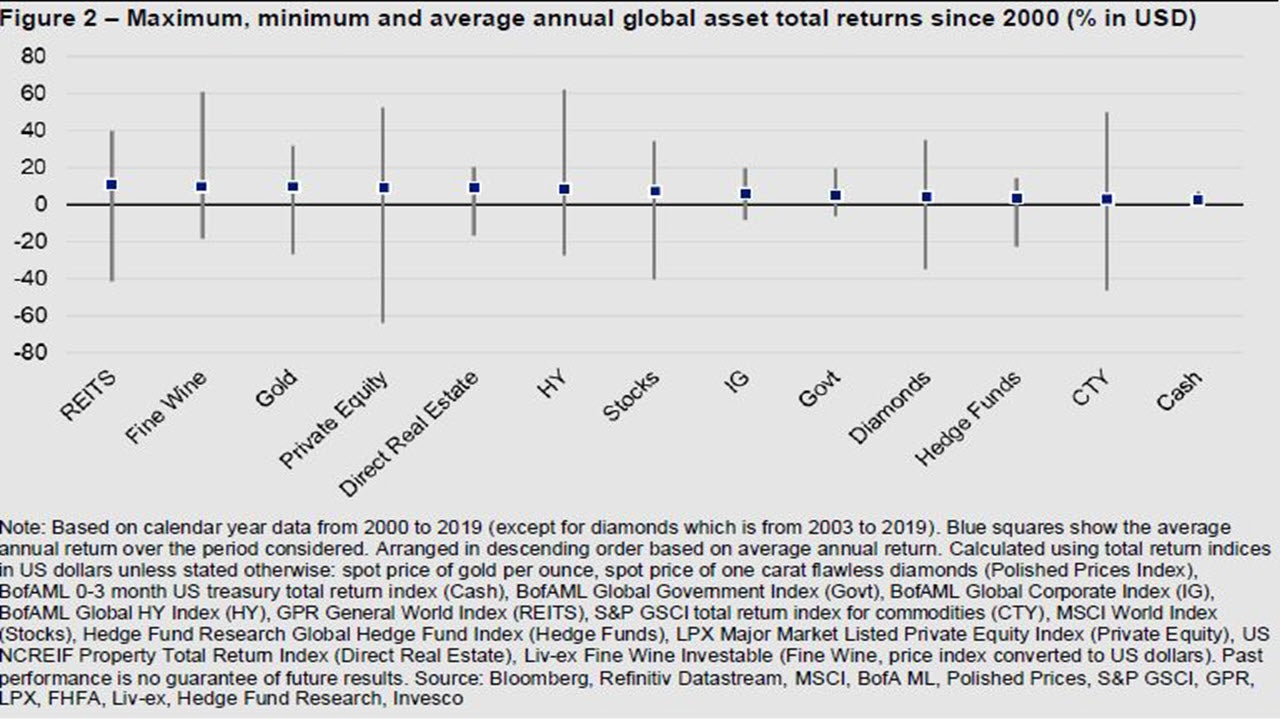
Turning to hedge funds and private equity, they would appear to have very different characteristics. Over the period considered, hedge funds appear to have produced less return with more volatility than government debt (and with higher correlation to other assets). Figure 2 also shows that hedge funds have experienced more downside than government debt (again based on calendar year returns).
Over the period considered hedge funds could be grouped with fixed income assets such as cash, government debt and investment-grade credit (IG). However, they could be said to have been dominated by government bonds and didn’t offer a viable trade-off (in terms of getting more return in exchange for more risk). Nevertheless, they did offer an option versus cash – it is a matter of personal choice as to whether we prefer the higher returns of hedge funds, given that they come with higher volatility than cash.
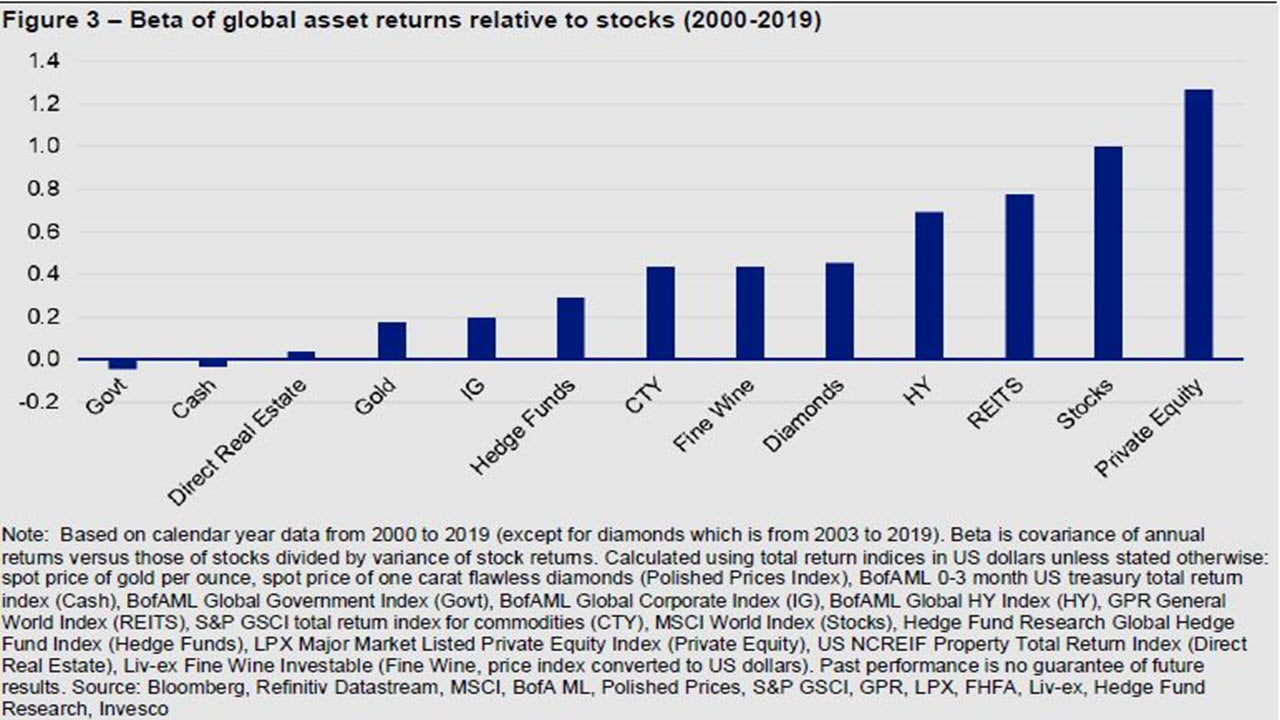
Private equity, on the other hand, is where we might have expected it to be in relation to publicly quoted equities (more return but with more volatility), as evidenced in Figures 1 & 2. Based on this, we would guess that private equity performs particularly well in market upswings and poorly in downswings. Indeed, this would appear to be the case, based on the asset class betas shown in Figure 3 (note that the betas are calculated relative to stocks, which we use as a proxy for the economic and market cycle).
Private equity (1.27) is the only asset class with a beta relative to stocks above 1.0, though high-yield (0.69) and REITs (0.77) also have elevated betas, which is why we group them along with equities into an “equity-like” category. Our analysis would suggest that we can now add private equity to that group.
Given their different characteristics, it could be said that private equity is from Mars (which blows hot and cold), while hedge funds are from Venus (where the temperature is relatively stable, if extremely hot).
Interestingly, direct real estate is at the other end of the scale to REITs, with a beta close to zero (0.04) and low volatility (suggesting no cyclicality). Of course, the problem with direct real estate is one of liquidity (the sale price may not match the estimations that go into the indices). As with selling a home, such assets are only worth what a buyer will pay when we want to sell and liquidity has habit of drying up when we most need it.
There are of course ways to console oneself if things go wrong. Figures 1 and 2 suggest that fine wine investments have performed somewhere between private equity and REITs, though with less cyclicality (Figure 3). If delivery can be taken in kind, investment could turn to consumption, though we must then accept the disappointment of corked bottles (the vintners equivalent of default risk!).
If the role of private equity in a diversified portfolio seems clear (high beta exposure to market upswings), that of hedge funds is less obvious. However, perhaps we are being overly harsh on hedge funds: first, it is always possible that the last 20 years is not representative of their performance and, second, there is a wide spectrum of hedge fund strategies and grouping them all together may be wrong.
Concerning the representativeness of the last 20 years, it is interesting to note that among the 13 asset classes we consider, hedge funds were in the top threeperformers in 1999, 2000 and 2001. However, until 2020 they had since been among the top half of assets only once (2013). That is a long time to be out of favour: we doubt it is an unrepresentative period.
There is a plethora of hedge fund strategies. The performance records of the more common strategies suggest to us that they behave more like cash and government bonds than equities. This is true even for equity hedge funds (see Figure 4). Indeed, the risk-reward profiles of many strategies appear to be somewhere between those of cash and stocks. This is true for absolute return, macro/CTA (commodity trading advisors), event driven and equity strategies.
This may be by design, with the aim of offering investors a range of risk profiles. If it is, the strategies have not been very successful. Combinations of cash and equities would have done better due to the convex nature of the efficient frontier: because the correlation between the two assets is less than one, the return available for any given level of volatility is higher than that indicated by the straight line running between the two assets (not shown in Figure 4).
The only hedge fund strategy that appears to have done better than the cash/equity efficient frontier is merger arbitrage, which has a similar profile to government debt. Note that market neutral equity strategies have produced less return than cash, with higher volatility.
In summary, we draw the following conclusions about the alternative assets that we have examined:
- First, real estate would appear to have an important role to play in an asset allocation framework. REITs would have been at one end of our efficient frontier (based on data from the last 20 years). Direct real estate investments offered lower returns than REITs but with lower volatility and correlation to other assets (thus offering interesting diversification opportunities). Given the lower liquidity of direct real estate, we view it as a core strategic rather than tactical asset.
- Private equity should be part of the “equity-like” group, with more volatility and higher return potential than publicly quoted stocks. However, given the higher volatility (no doubt linked to lower liquidity), we would consider private equity to be more “early-cycle” than “late-cycle”. To this extent it has much in common with high-yield credit.
- Hedge funds are more problematic (in our opinion). In many cases they have performed like fixed income assets but with worse characteristics (more volatility and lower returns than government debt). A combination of cash and stocks would have done better than most strategies. Given the illiquidity of many hedge funds, it is hard to view them as a tactical asset. However, these are comments about broad categories and may not apply to individual hedge funds.
- To the extent that commodities are considered an alternative asset, the experience of the last 20 years seems to be in line with much longer sample periods: for the same sort of volatility as stocks they generate total returns more in line with cash. Nevertheless, our optimisations based on long term returns suggest a strategic role for commodities, no doubt due to the low correlation with other assets (see the 21st Century Portfolio). However, they can also perform a tactical role, with industrial commodities, for example, tending to perform well in the latter stages of the economic cycle (according to our analyses).
- Gold is a conundrum. There is no arguing with the performance history of the last 20 years. With hindsight, it should have been a core holding over that period but who was that brave 20 years ago when gold was touching multi-decade lows in real terms? Measured over longer periods, it has performed more like broad commodity indices have done over the last 20 years, while offering less diversification. We would view it as a tactical, rather than strategic, holding.
- Sticking with jewellery, diamonds have done less well than gold over the last 20 years and have been more in line with broad commodity indices. We do not feel the need to include them in our framework.
- Finally, though fine wines have held their own from a performance perspective over the last 20 years, we do not consider them suitable for our asset allocation purposes. However, even this tee-total author can appreciate the attraction.
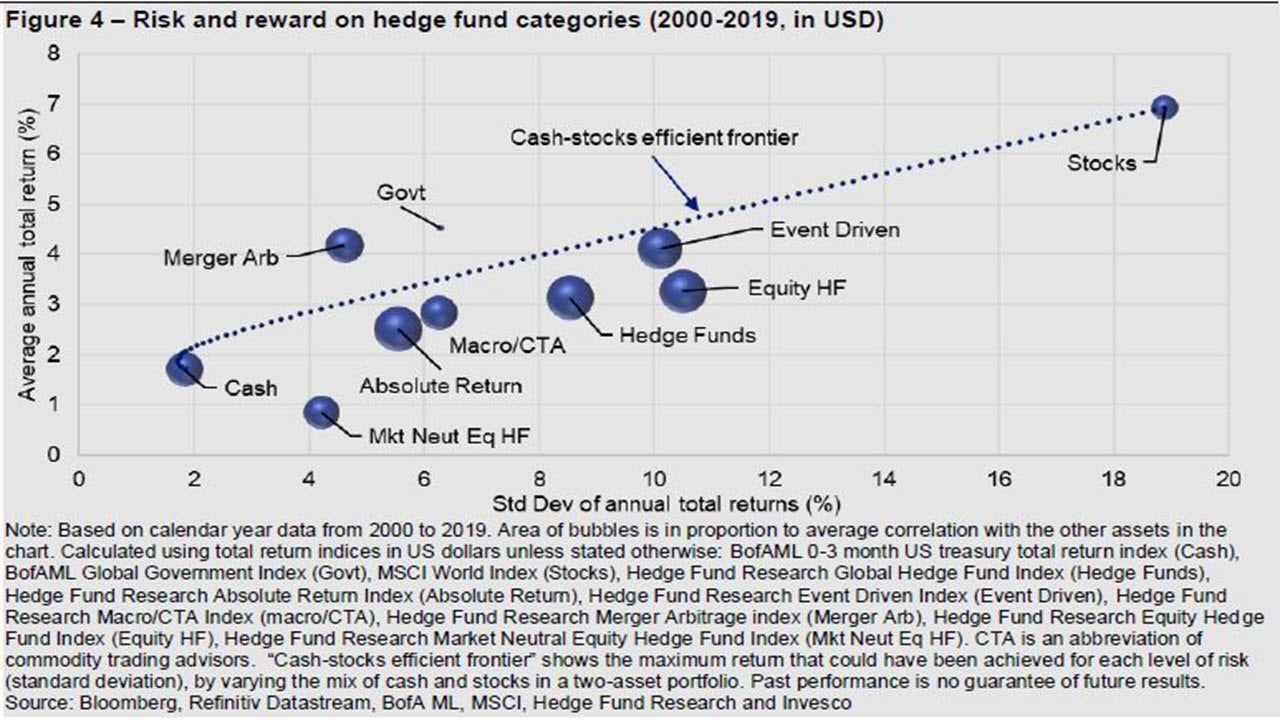
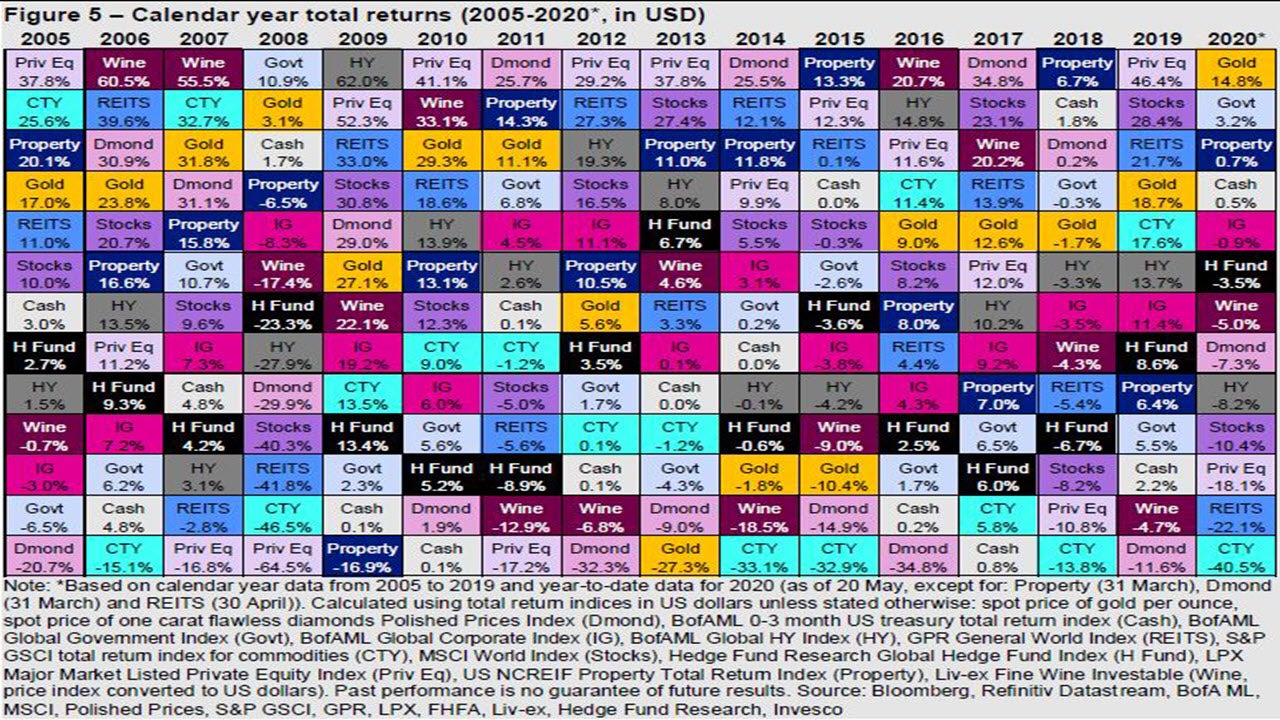
Figure 5 shows 2020 performance (up to 20 May) and the outcomes are broadly in line with what might be expected during a period of recession: the more “defensive” assets (gold, government debt, cash and IG) are at the top of the rankings, while the more “cyclical” categories (commodities, REITS, private equity, stocks and HY) are at the bottom.
Among alternatives, the conclusions of the above analysis seem to have held during this extraordinary environment: first, private equity has suffered more than its publicly quoted brethren (stocks); second, hedge funds (HF) have been a poor version of government debt and, third, gold has been the best defensive asset, while commodities has been the most cyclical. None of the HF strategies that we measure produced positive returns: Macro/CTA came the closest (-0.2%), while equity and market-neutral equity strategies were the worst (-9.3% for both).
More surprising is that direct real estate (property) has done so well. However, the data for that asset class is only up to March 31. Given the illiquid nature of the asset, we suspect it will need time for the full effect of this recession to be reflected in values. Hence, we expect the index performance to deteriorate relative to that of more liquid assets that have already integrated the recession into their values (REITS for example).
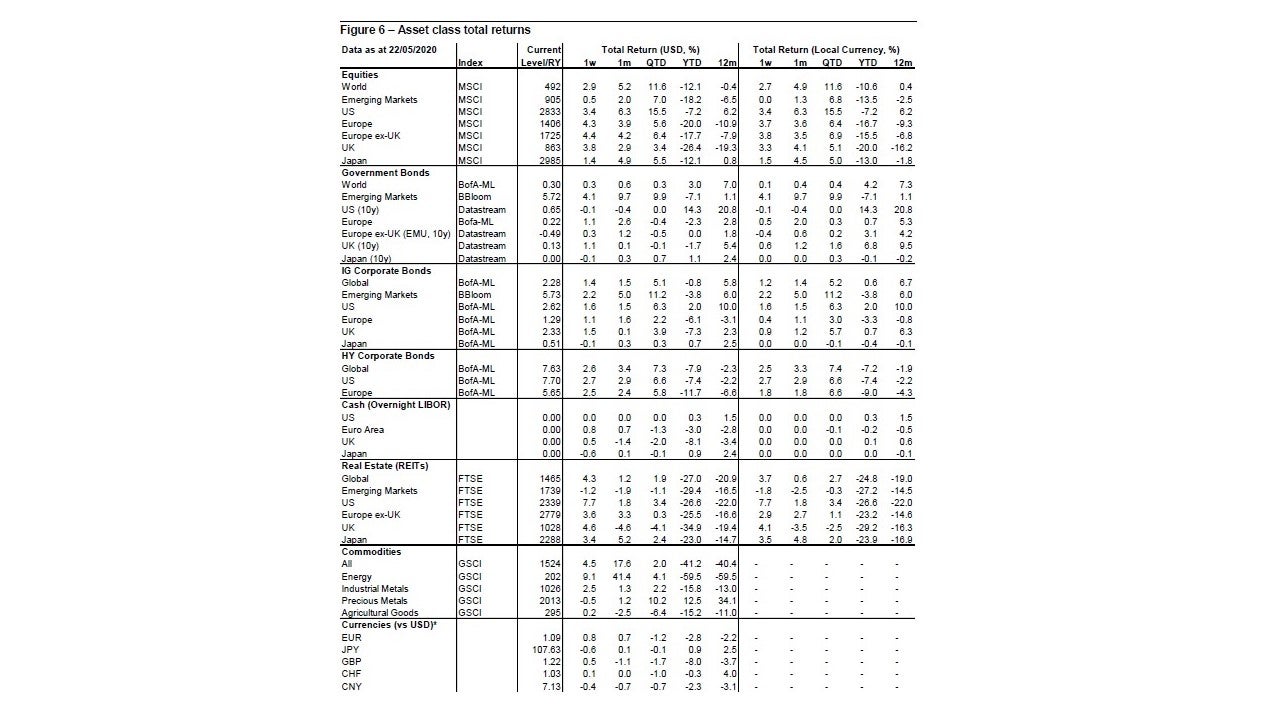
Looking forward to the recovery from recession, we would expect a reversal of many of those year-to-date patterns. Indeed, the performance so far during the second quarter (QTD) gives some clues as to what we think could happen. Figure 6 shows that cyclical categories such as equities, HY and some emerging market assets are leading the way, while government debt is struggling. Not shown in that table, private equity and HF have produced QTD returns of 17.0% and 3.6%, respectively (as of 20 May).
There are, however, some surprising elements that suggest cross currents: first, gold (precious metals) continues to be strong (perhaps due to concern about the implications of all the policy support); second, REITS are not yet recovering in the same way as equities (perhaps due to fears of long-term damage to the demand for commercial real estate) and, finally, the rebound in oil is not fully reflected in the quarter-to-date performance of energy (because oil didn’t bottom until the end of April).
All data as of 22 May, unless stated otherwise.
András Vig, Multi-Asset Strategist with the Global Market Strategy Office, also contributed to the article.
Appendix
-
Methodology for asset allocation, expected returns and optimal portfolios
Portfolio construction process
The optimal portfolios are theoretical and not real. We use optimisation processes to guide our allocations around “neutral” and within prescribed policy ranges based on our estimations of expected returns and using historical covariance information. This guides the allocation to global asset groups (equities, government bonds etc.), which is the most important level of decision. For the purposes of this document the optimal portfolios are constructed with a one-year horizon.
Which asset classes?
We look for investibility, size and liquidity. We have chosen to include: equities, bonds (government, corporate investment grade and corporate high-yield), REITs to represent real estate, commodities and cash (all across a range of geographies). We use cross-asset correlations to determine which decisions are the most important.
Neutral allocations and policy ranges
We use market capitalisation in USD for major benchmark indices to calculate neutral allocations. For commodities, we use industry estimates for total ETP market cap + assets under management in hedge funds + direct investments. We use an arbitrary 5% for the combination of cash and gold. We impose diversification by using policy ranges for each asset category (the range is usually symmetric around neutral).
Expected/projected returns
The process for estimating expected returns is based upon yield (except commodities, of course). After analysing how yields vary with the economic cycle, and where they are situated within historical ranges, we forecast the direction and amplitude of moves over the next year. Cash returns are calculated assuming a straight-line move in short term rates towards our targets (with, of course, no capital gain or loss). Bond returns assume a straight-line progression in yields, with capital gains/losses predicated upon constant maturity (effectively supposing constant turnover to achieve that). Forecasts of corporate investment-grade and high-yield spreads are based upon our view of the economic cycle (as are forecasts of credit losses). Coupon payments are added to give total returns. Equity and REIT returns are based on dividend growth assumptions. We calculate total returns by applying those growth assumptions and adding the forecast dividend yield. No such metrics exist for commodities; therefore, we base our projections on US CPI-adjusted real prices relative to their long-term averages and views on the economic cycle. All expected returns are first calculated in local currency and then, where necessary, converted into other currency bases using our exchange rate forecasts.
Optimising the portfolio
Using a covariance matrix based on monthly local currency total returns for the last 5 years and we run an optimisation process that maximises the Sharpe Ratio. Another version maximises Return subject to volatility not exceeding that of our Neutral Portfolio. The optimiser is based on the Markowitz model.
Currency hedging
We adopt a cautious approach when it comes to currency hedging as currency movements are notoriously difficult to accurately predict and sometimes hedging can be costly. Also, some of our asset allocation choices are based on currency forecasts. We use an amalgam of central bank rate forecasts, policy expectations and real exchange rates relative to their historical averages to predict the direction and amplitude of currency moves.
Definitions of data and benchmarks for Figure 6
Sources: we source data from Datastream unless otherwise indicated.
Cash: returns are based on a proprietary index calculated using the Intercontinental Exchange Benchmark Administration overnight LIBOR (London Interbank Offer Rate). The global rate is the average of the euro, British pound, US dollar and Japanese yen rates. The series started on 1st January 2001 with a value of 100.
Gold: London bullion market spot price in USD/troy ounce.
Government bonds: Current levels, yields and total returns use Datastream benchmark 10-year yields for the US, Eurozone, Japan and the UK, and the Bank of America Merrill Lynch government bond total return index for the World and Europe. The emerging markets yields and returns are based on the Barclays Bloomberg emerging markets sovereign US dollar bond index.
Corporate investment grade (IG) bonds: Bank of America Merrill Lynch investment grade corporate bond total return indices, except for in emerging markets where we use the Barclays Bloomberg emerging markets corporate US dollar bond index.
Corporate high yield (HY) bonds: Bank of America Merrill Lynch high yield total return indices
Equities: We use MSCI benchmark gross total return indices for all regions.
Commodities: Goldman Sachs Commodity total return indices
Real estate: FTSE EPRA/NAREIT total return indices
Currencies: Global Trade Information Services spot rates


