An update on the performance of Gold

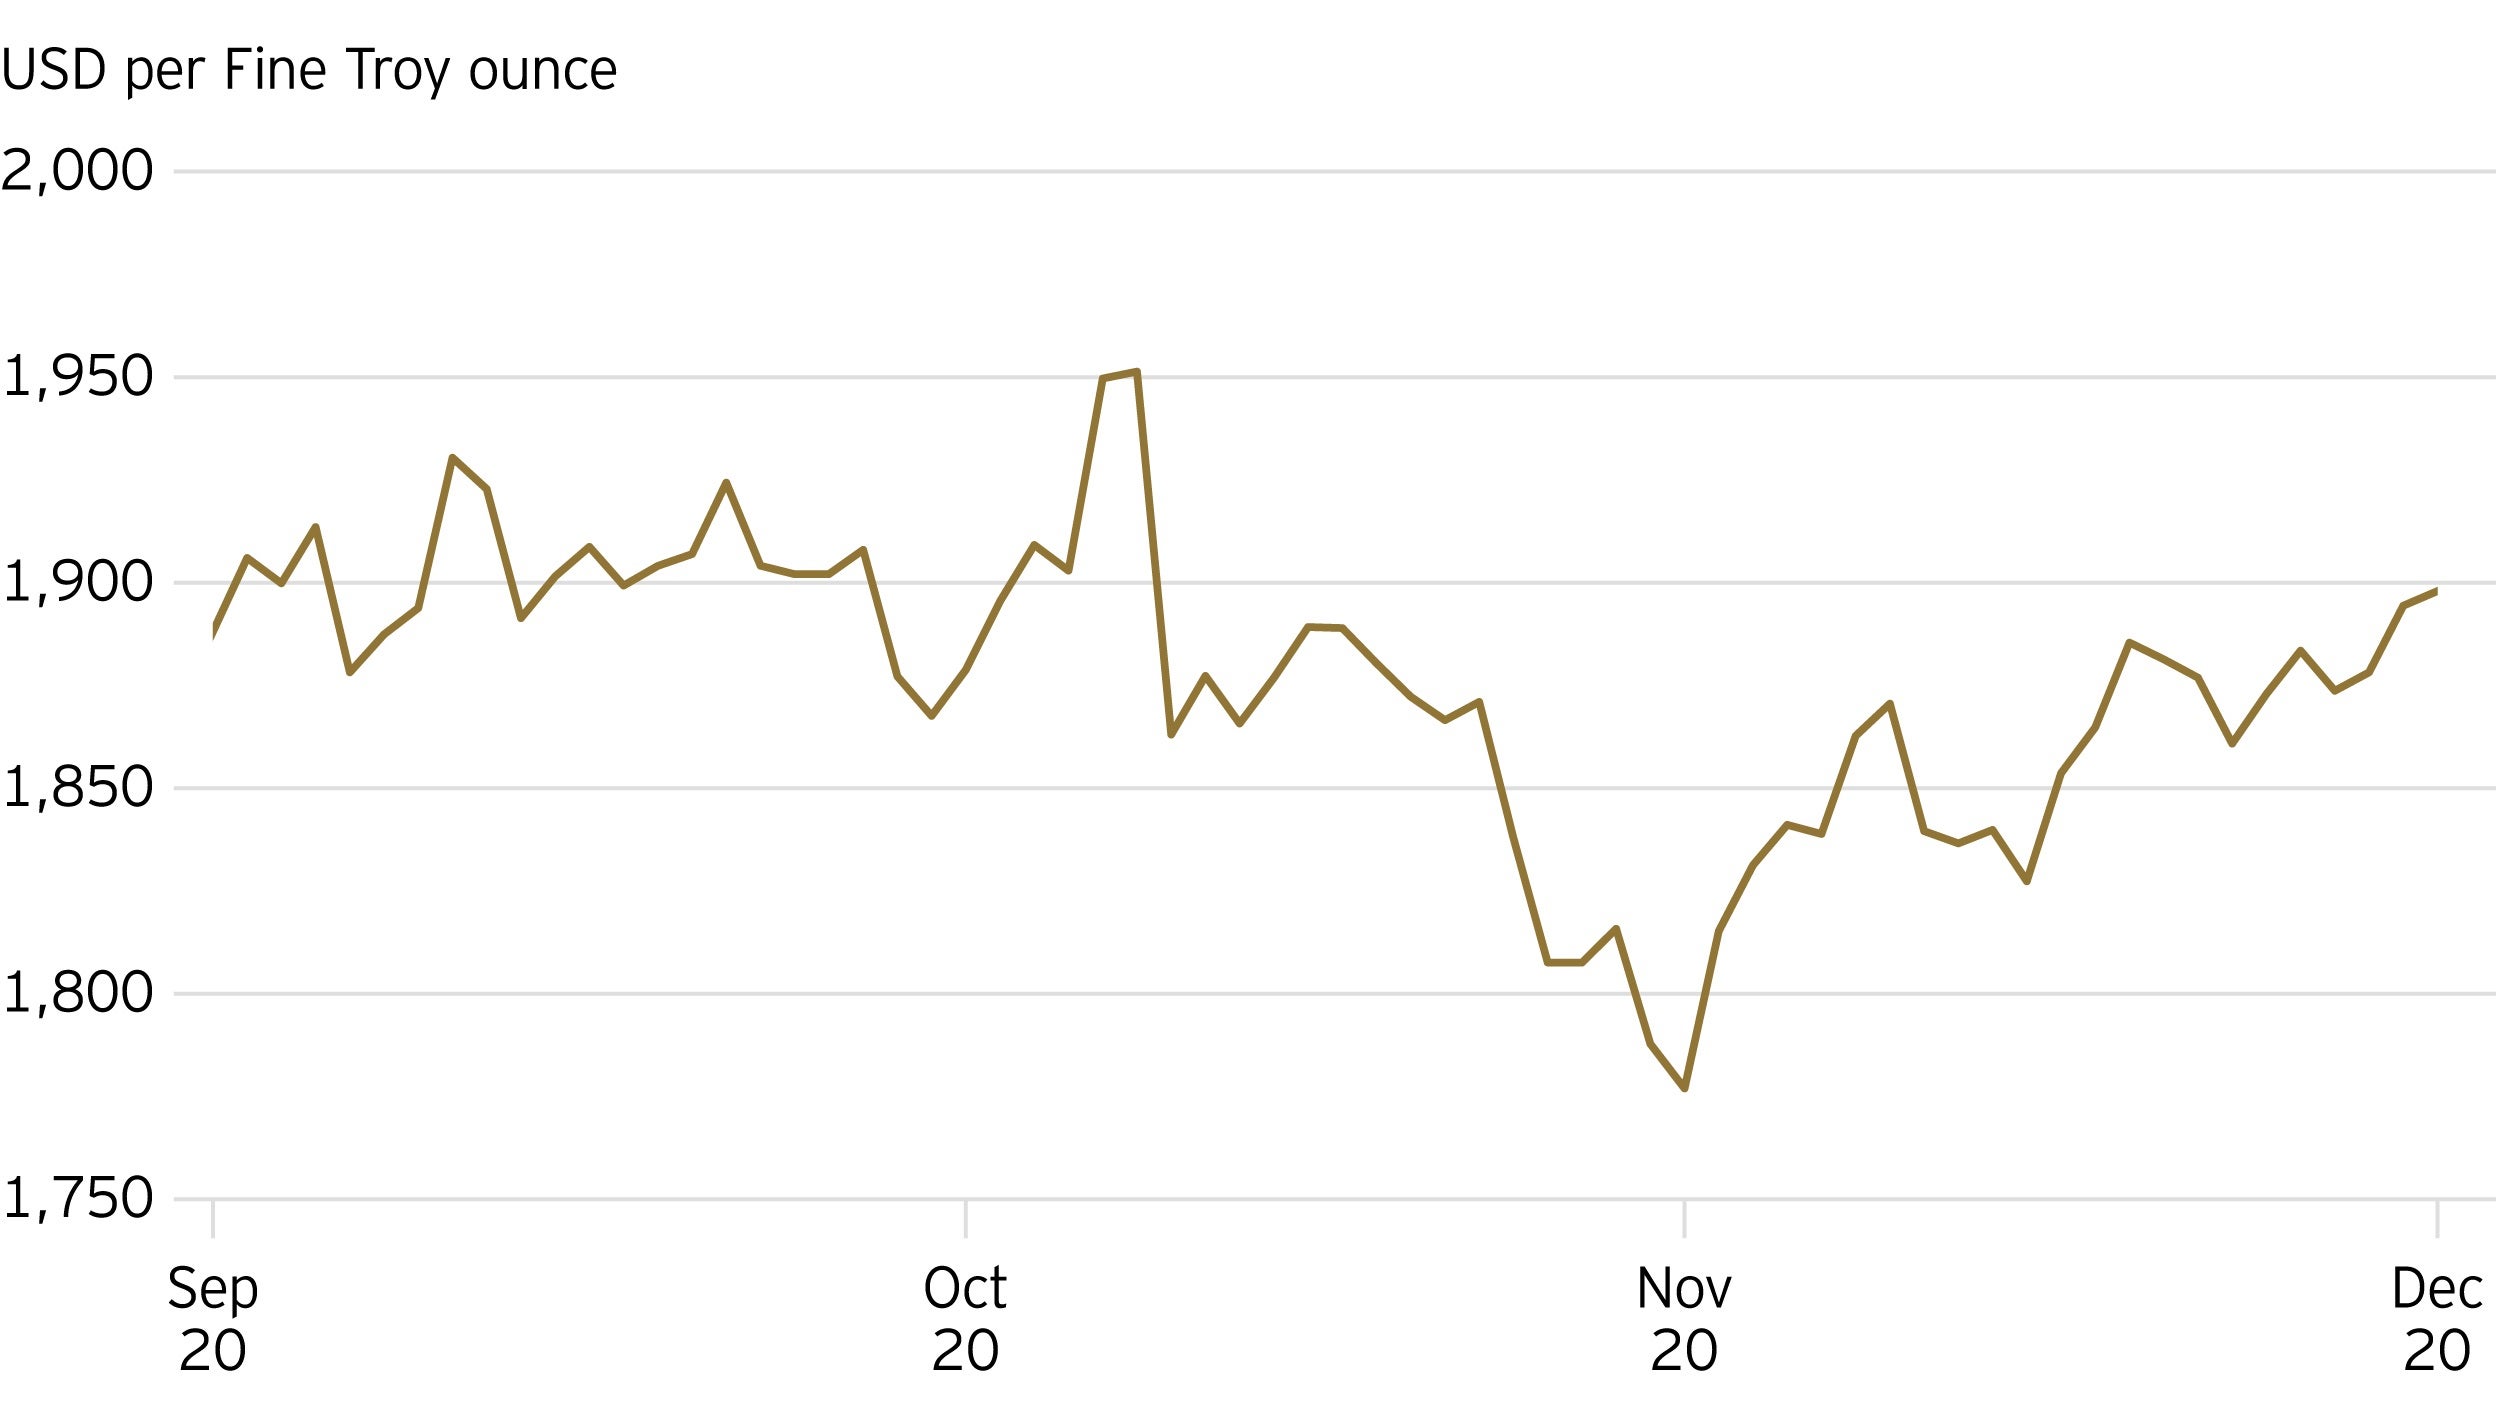
On the surface, it would appear to have been a quiet quarter, with the gold price broadly flat over the period. And perhaps this could have been expected given the US election results removing some political uncertainty and news on vaccines planting seeds of hope for a return to greater normality.
In this Gold report, we look beneath the surface at some of the key factors that drove the performance of the precious metal, as well as how gold fared relative to other asset classes.
Market performance
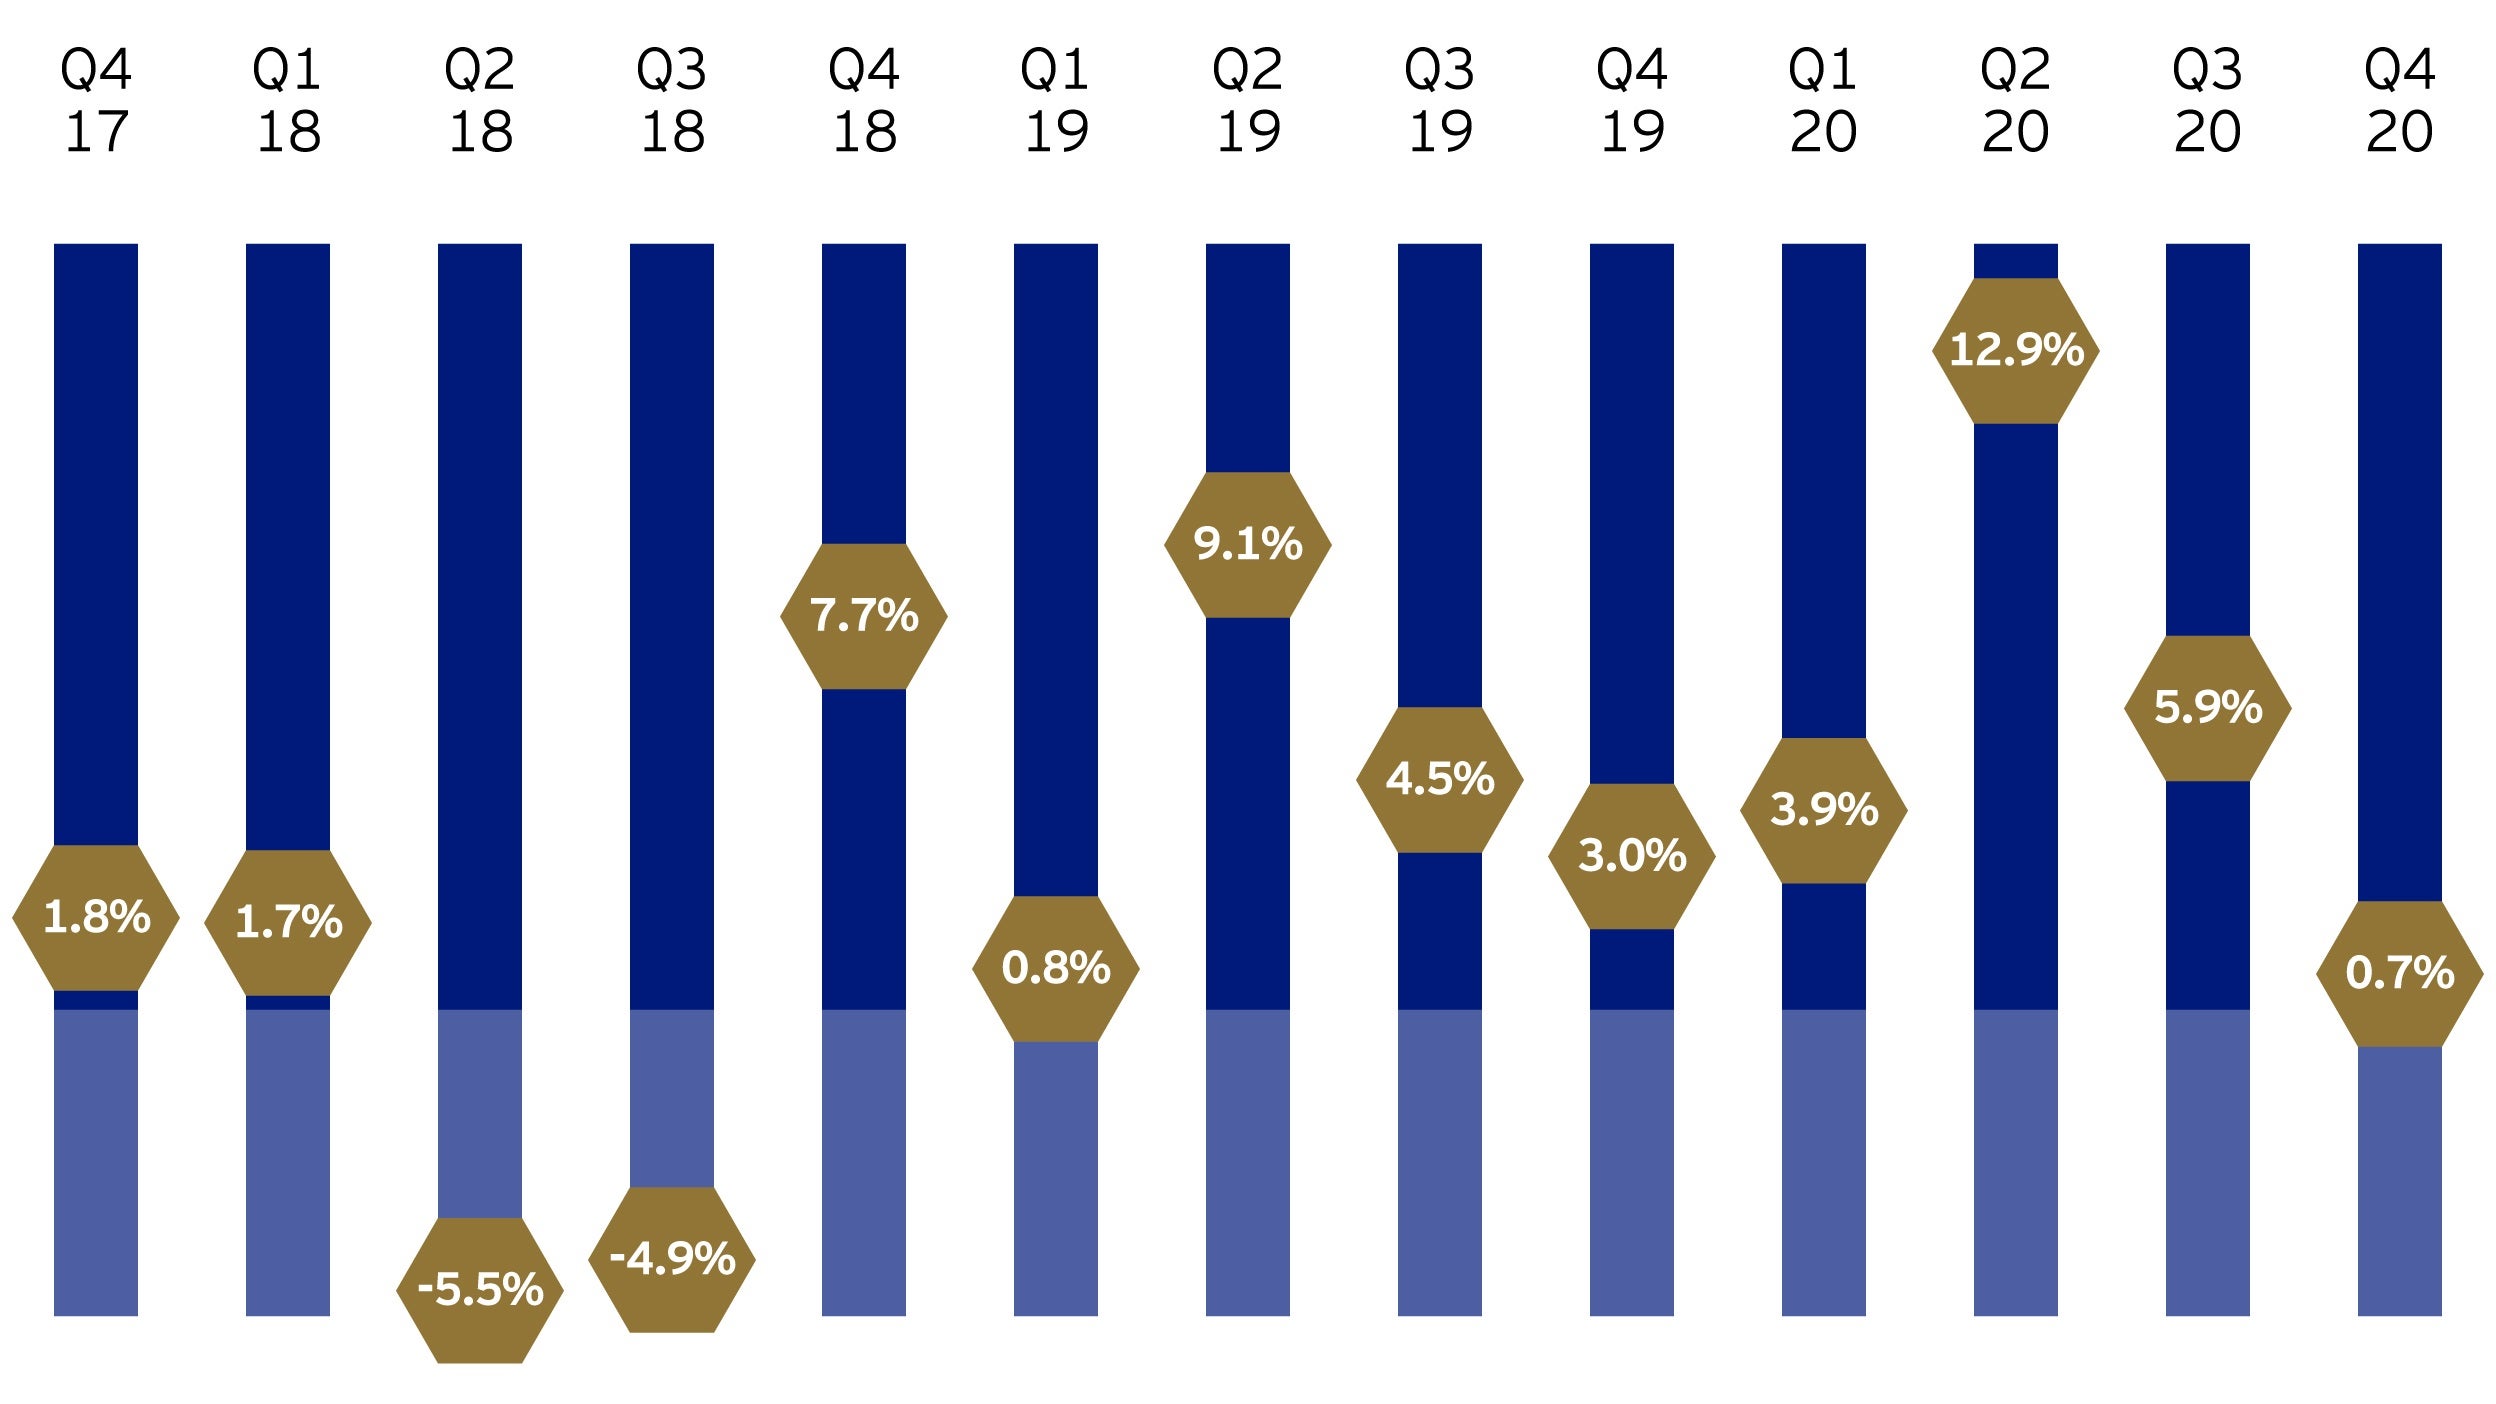
Gold managed to end the fourth quarter on a positive note in what was a challenging final period for the precious metal. Gold recorded a gain of 0.7% for the quarter, having ended the year at $1,898 an ounce.
Following the record-breaking third quarter, during which time gold broke through $2,000 an ounce for the first time in history, the price by the end of November had fallen to its lowest level since the summer as positive vaccine news and expectations that the Democrats might achieve a clean sweep in US elections impacted sentiment. In hindsight, the selloff may have been overdone as gold rallied sharply to end the quarter a shade above where it began (+0.7% for the quarter).


Although Q4 2020 was the weakest quarter for gold since Q3 2018, the metal extended its run of consecutive positive quarterly returns to nine.
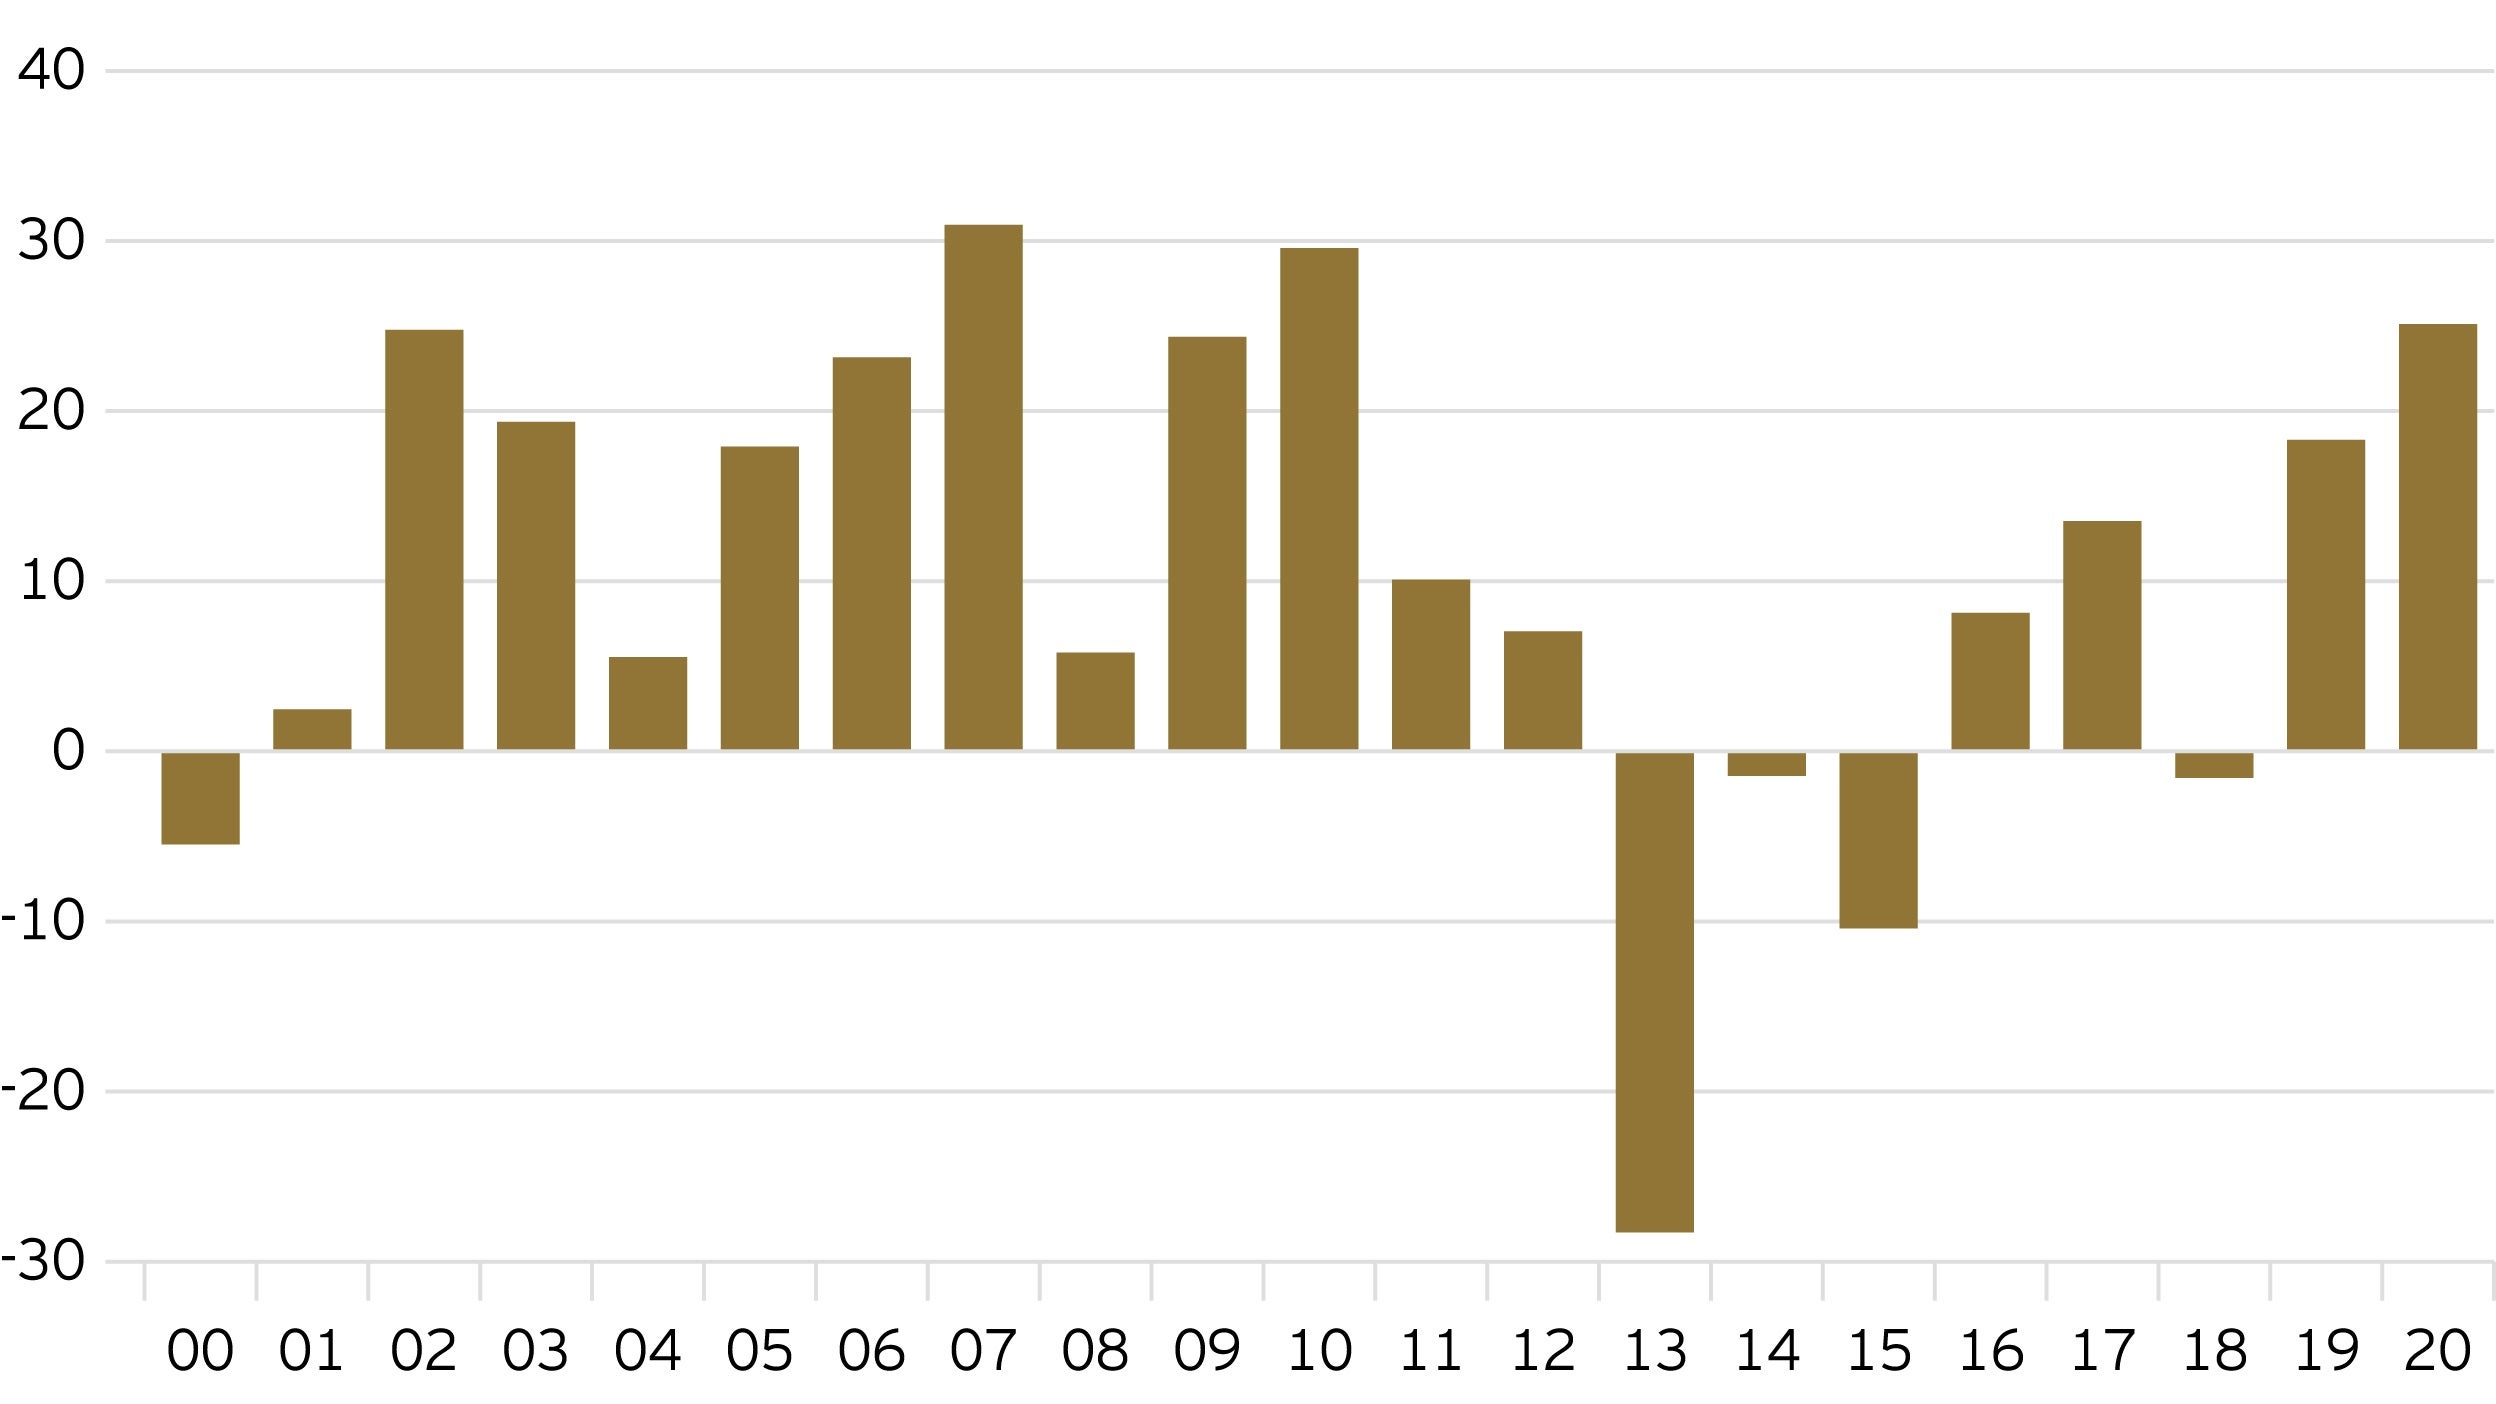
Despite the relatively weak quarter, with gold down just under 8% from the all-time high of $2,052 it reached on 23 August, the very strong run leading up to that record meant that 2020 still turned out to be the strongest calendar year for the metal in a decade. Gold returned 25.1% in 2020, the highest return since the 29.6% achieved in 2010.

Other asset class returns
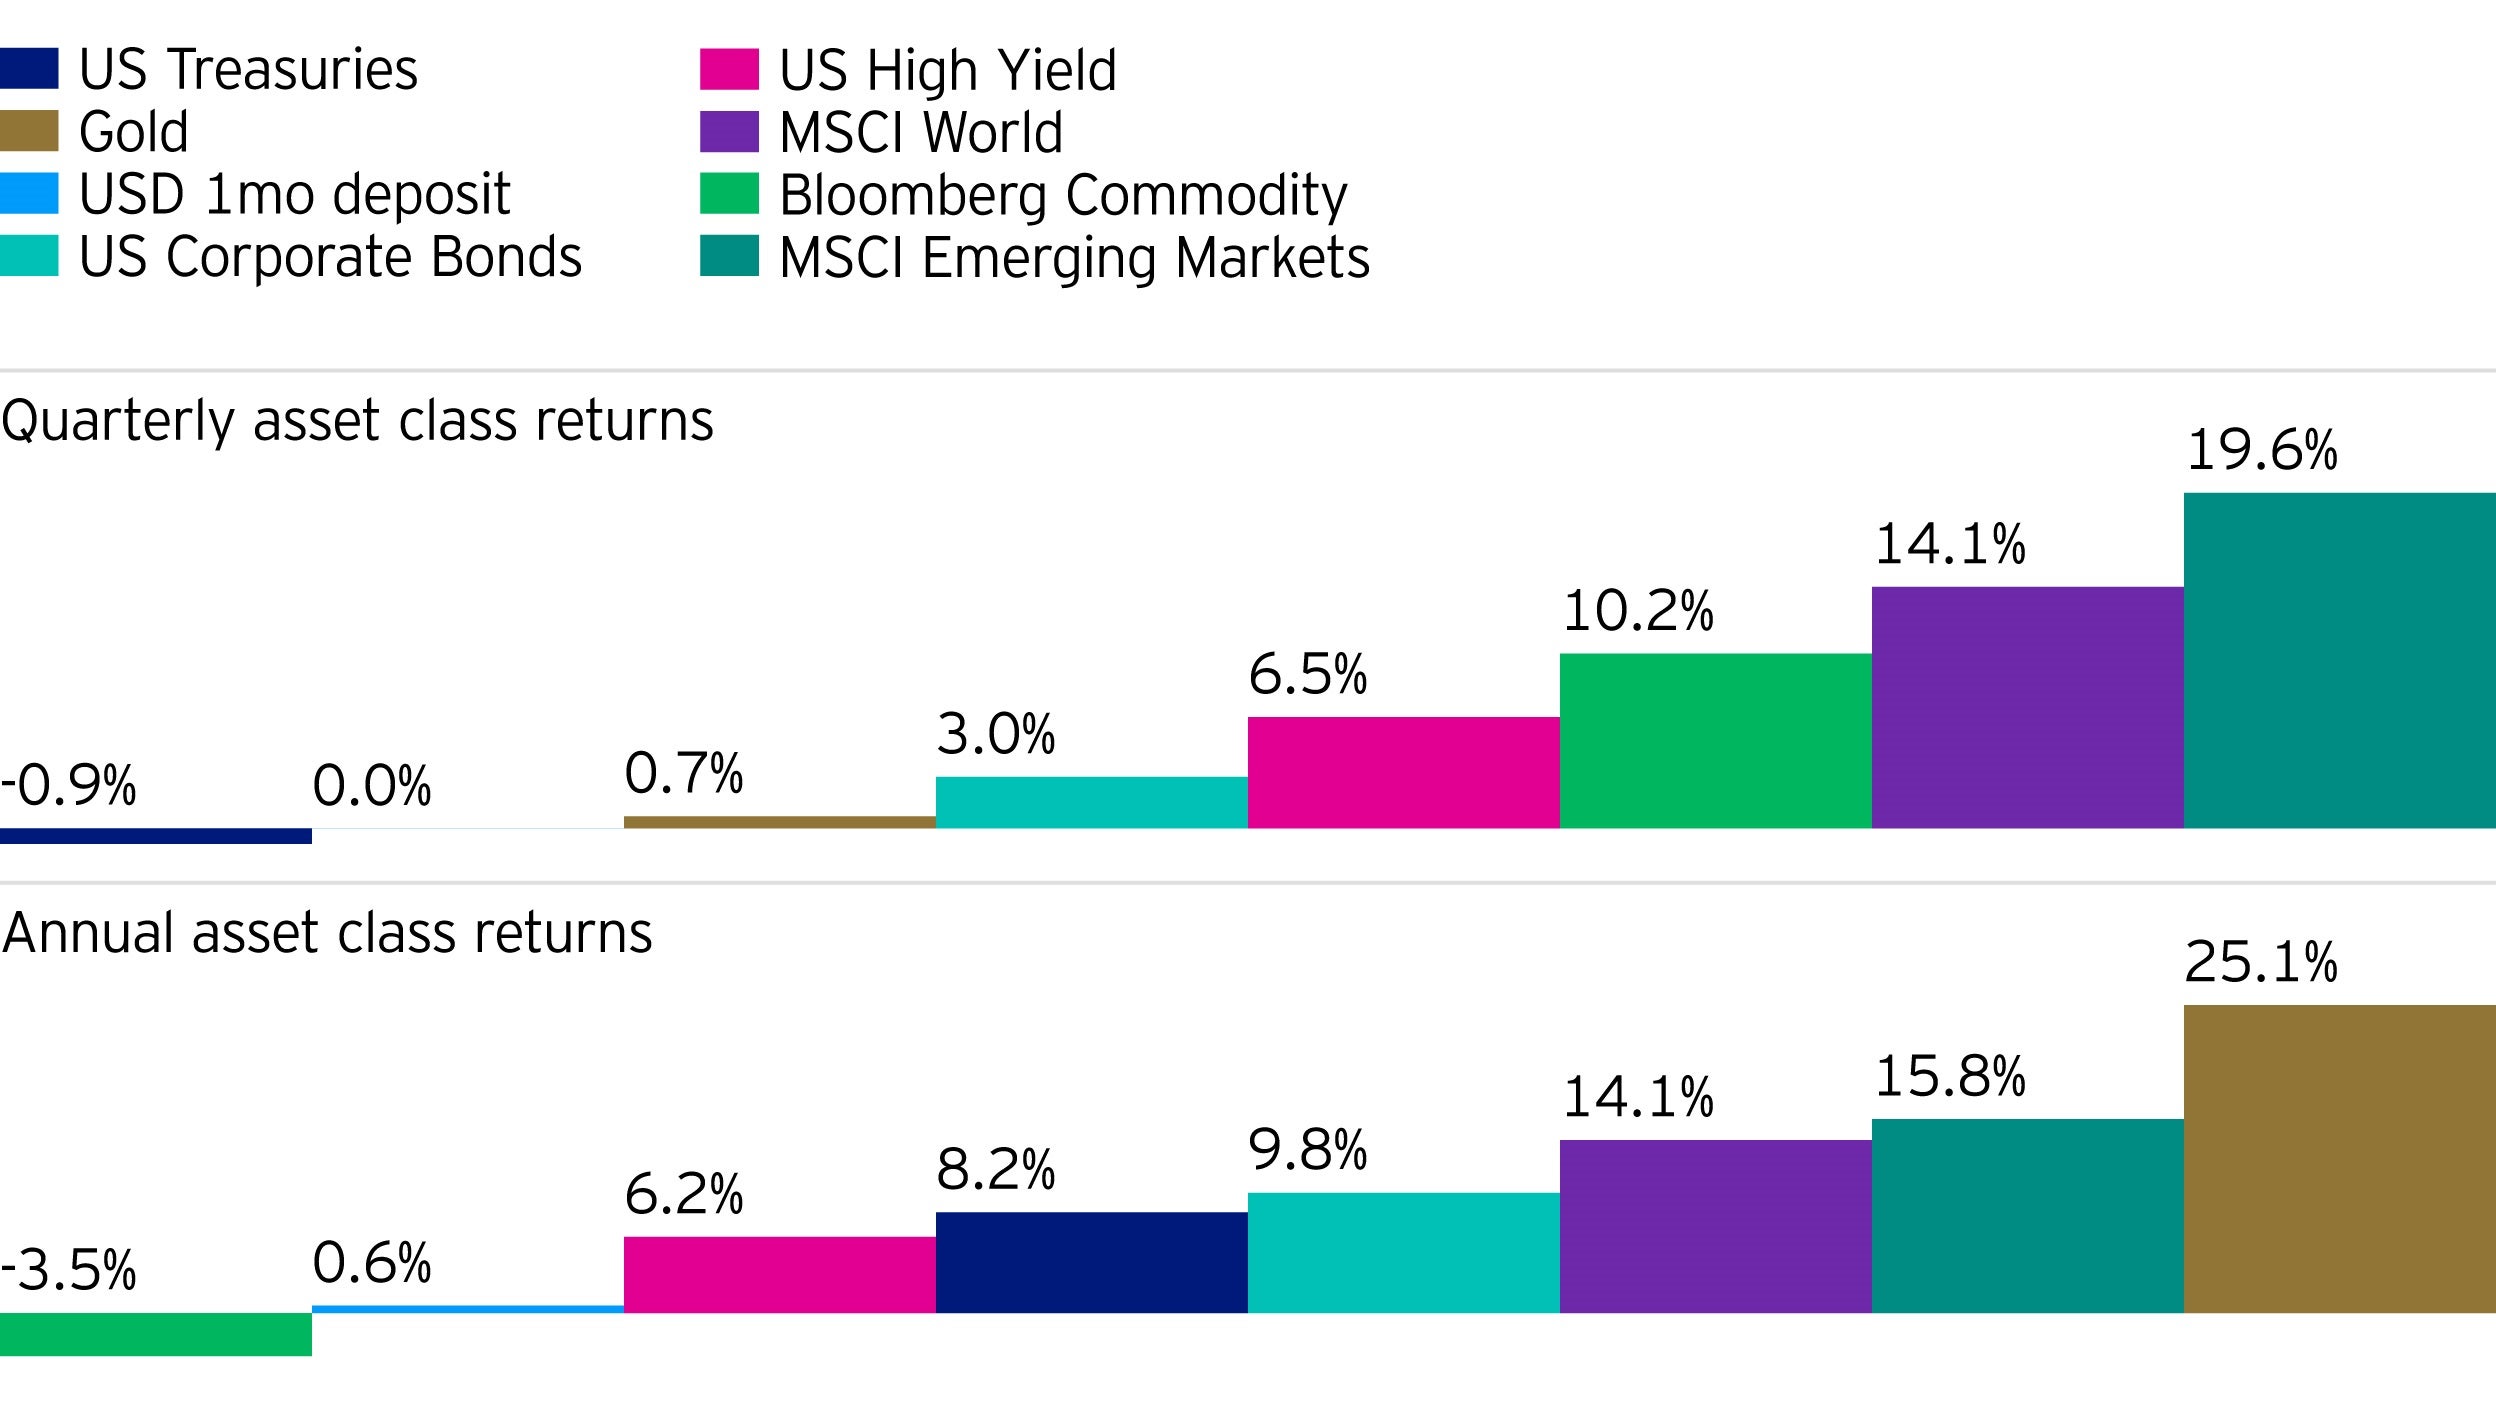
News of effective coronavirus vaccines was a pivotal event for markets in the fourth quarter, giving cause for many investors to favour riskier assets with equities and economically sensitive commodities being the chief beneficiaries. The strongest performance in the quarter came from emerging market equities, with the MSCI Emerging Market index gaining 19.6% in USD terms. The risk-on background hurt US Treasuries, with the yield-to-maturity on the 10-year bond rising 24 basis points, pushing returns into negative territory (-0.9%).
The rally in riskier asset towards the end of the year wasn’t enough to knock gold from its best-performer status for 2020. With 12-month returns of just over 25%, it clearly outperformed other asset classes. Expectations for a strong economic recovery in 2021 were not enough to lift broad commodities (including energy commodities, grains, livestock, precious metals and industrial metals) from being the year’s weakest performer, the only asset class to have a negative return (-3.5%) in 2020. Commodity returns were depressed by very weak energy prices, more than offsetting strong performance elsewhere, such as in industrial metals.

Standardised rolling past performance
| Asset class | Benchmark used | 2016 | 2017 | 2018 | 2019 | 2020 |
| Gold price | LBMA Gold Price (PM) | 8.1% | 13.5% | -1.6% | 18.3% | 25.1% |
| US Treasuries | ICE BofA US Treasury Index | 1.1% | 2.4% | 0.8% | 7.0% | 8.2% |
| US Corporate Bonds | ICE BofA US Corporate Index | 6.0% | 6.5% | -2.3% | 14.2% | 9.8% |
| USD 1-month deposit | USD 1-month deposit rate | 0.6% | 1.1% | 2.0% | 2.3% | 0.6% |
| US High Yield | ICE BofA US High Yield Index | 17.5% | 7.5% | -2.3% | 14.4% | 6.2% |
| MSCI World | MSCI World Index | 5.3% | 20.1% | -10.4% | 25.2% | 14.1% |
| MSCI Emerging Markets | MSCI Emerging Markets Index | 8.6% | 34.4% | -16.6% | 15.4% | 15.8% |
| Bloomberg Commodity | Bloomberg Commodity Index | 11.4% | 0.8% | -13.0% | 5.4% | -3.5% |
Past performance is not a guide to future returns. Performance figures are Total Return, in USD, as at 31 December 2020. Source: Bloomberg.


