Nasdaq 100 Index – Commentary

Accessing Innovation in the US
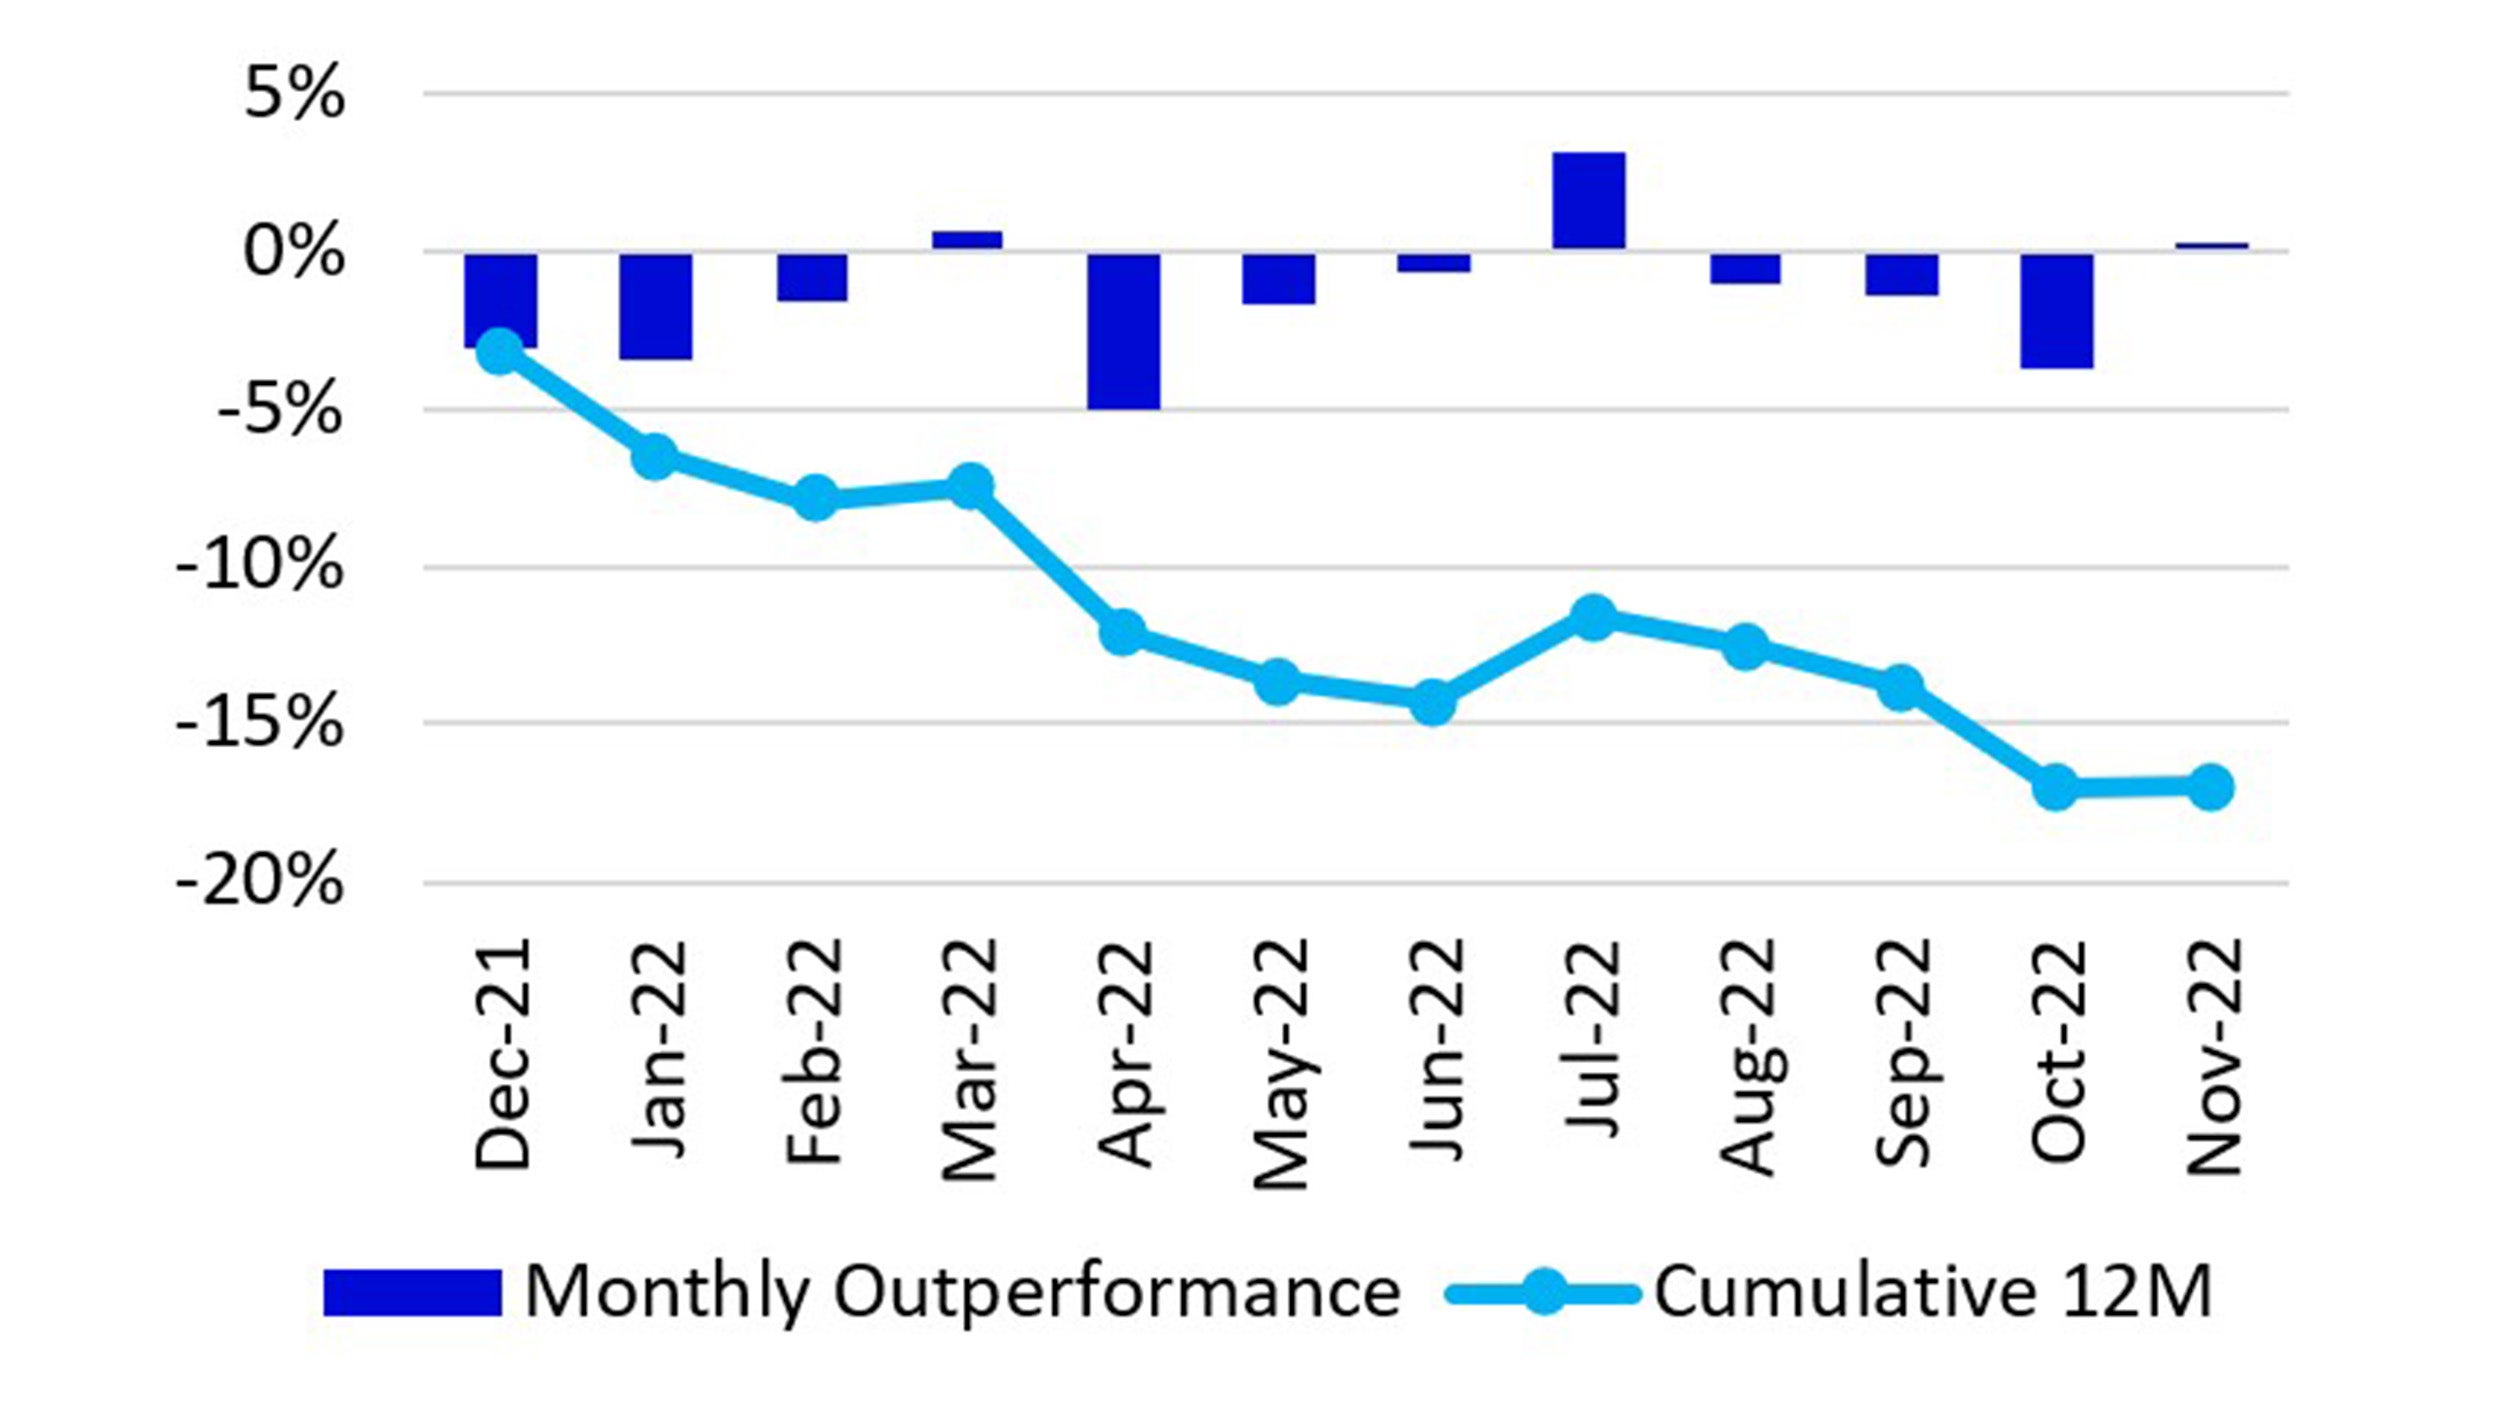
For the month of November, the Nasdaq 100 Index (NDX) returned 5.6%, slightly outperforming the S&P 500 Index which returned 5.5%. After a minor pullback at the beginning of the month, equity markets continued their move upwards that started in the middle of October. Employment numbers remained strong supporting the Federal Open Market Committee’s (FOMC) hope that a soft landing may still be possible to achieve, despite ongoing rate hikes to combat inflation. The markets also saw yields on treasuries fall and the US Dollar continue to weaken. Both factors contributed to investors favouring growth-oriented companies.
There were two primary catalysts behind the positive equity performance in November: a lower-than-expected CPI print which was reported on the 10th, and a speech delivered by Fed Chairman Jerome Powell on the 30th. The October year-over-year reading of CPI came in at 7.7%, below the 7.9% expectation from analysts. This is the fourth declining year-over-year inflation reading and led investors to the conclusion that inflation may have peaked in June where the reading was at 9.1%. The energy, food and commodities readings all declined from last month’s reading while the services component rose, albeit at a slower pace than September.
In a speech delivered on November 30th at the Brookings Institution in Washington D.C., Jerome Powell stated that it would make sense to moderate the pace of rate increases as they approach the level that would be sufficient to lower inflation. The Fed Chairman also stated that the time to moderate may come as early as the December FOMC meeting. Although the market, as per Bloomberg estimates, was already pricing in a 0.50% interest rate hike, investors perceived these statements as “dovish” and spurred the rally that was seen on the 30th.
Index performance
| 1M | YTD | 1Y | 10Y(ann.) | |
|---|---|---|---|---|
NASDAQ-100 |
5.6% | -25.9% | -25.0% | 17.1% |
| S&P 500 | 5.5% | -13.5% | -9.6% | 12.7% |
Relative |
0.1% | -14.3% | -17.0% | 3.9% |
Source: Bloomberg as of 30 Nov 2022.
Returns may increase or decrease as a result of current fluctuations. An investment cannot be made directly into an index.

Source: Bloomberg as of 30 Nov 2022.
Returns may increase or decrease as a result of current fluctuations. An investment cannot be made directly into an index.
Past performance does not predict future returns.

Data: Invesco, FactSet Data as of 30 Nov 2022. Data in USD. Returns may increase or decrease as a result of currency fluctuations.
Nasdaq 100 Performance Drivers
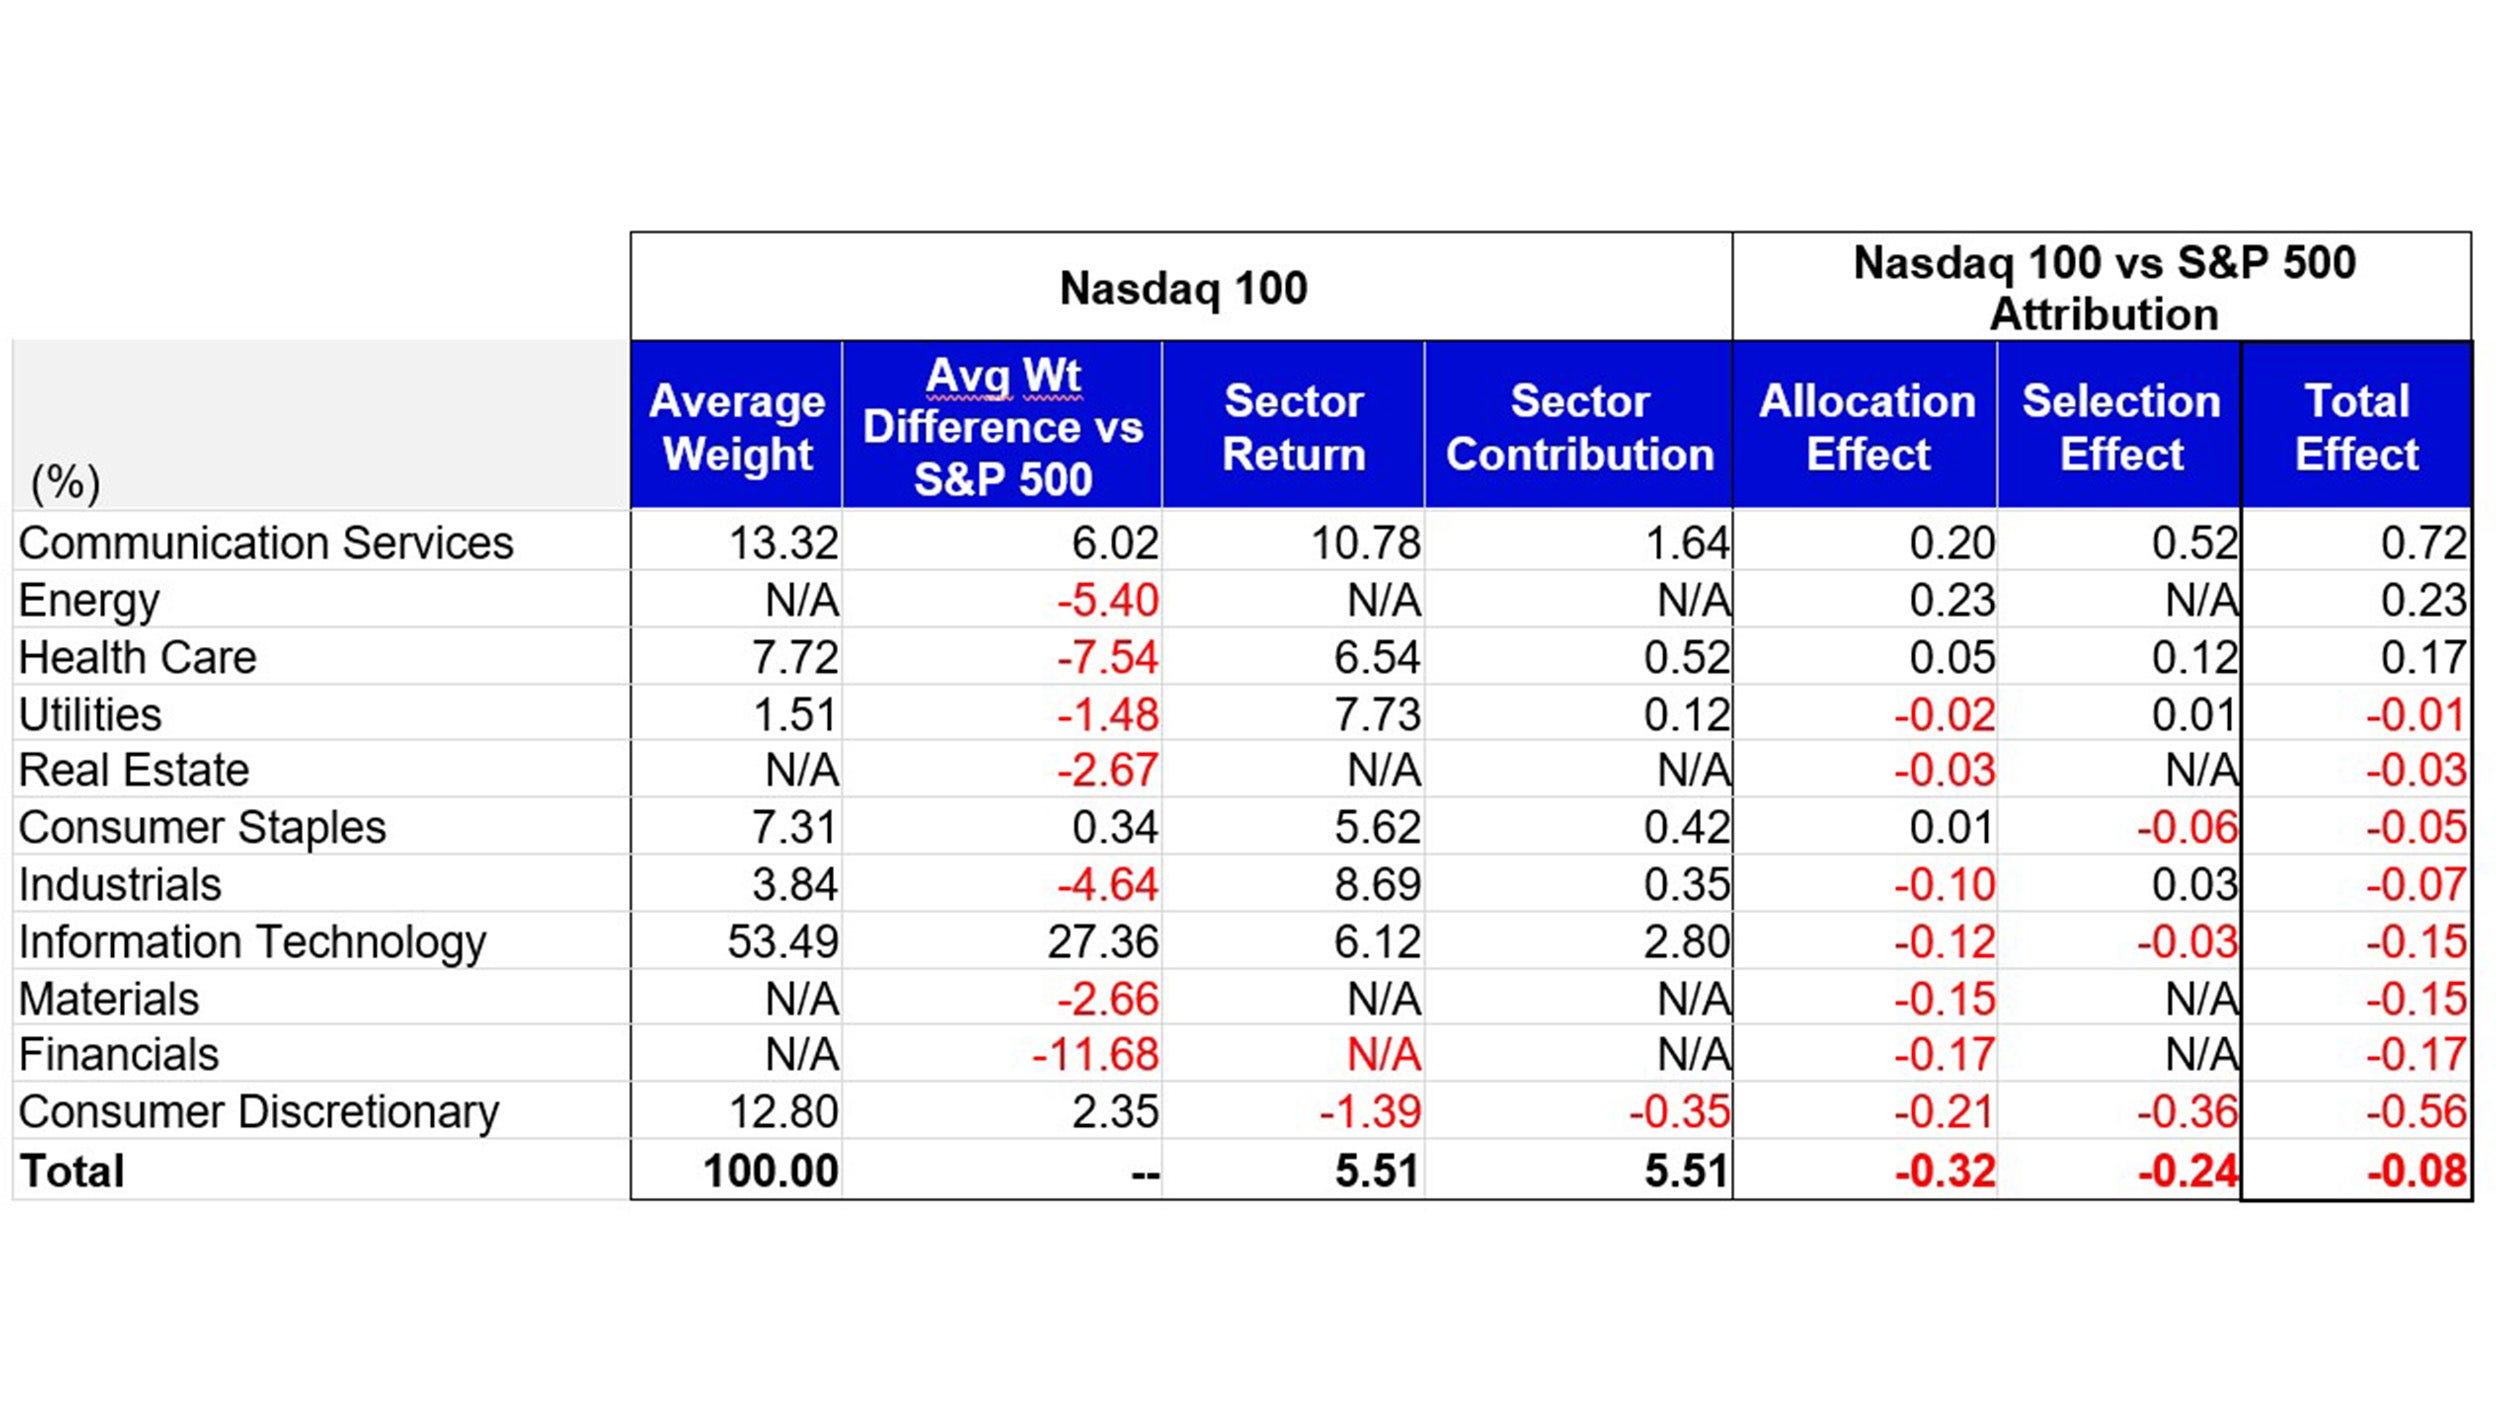
November performance attribution of the Nasdaq 100 vs the S&P 500 Index
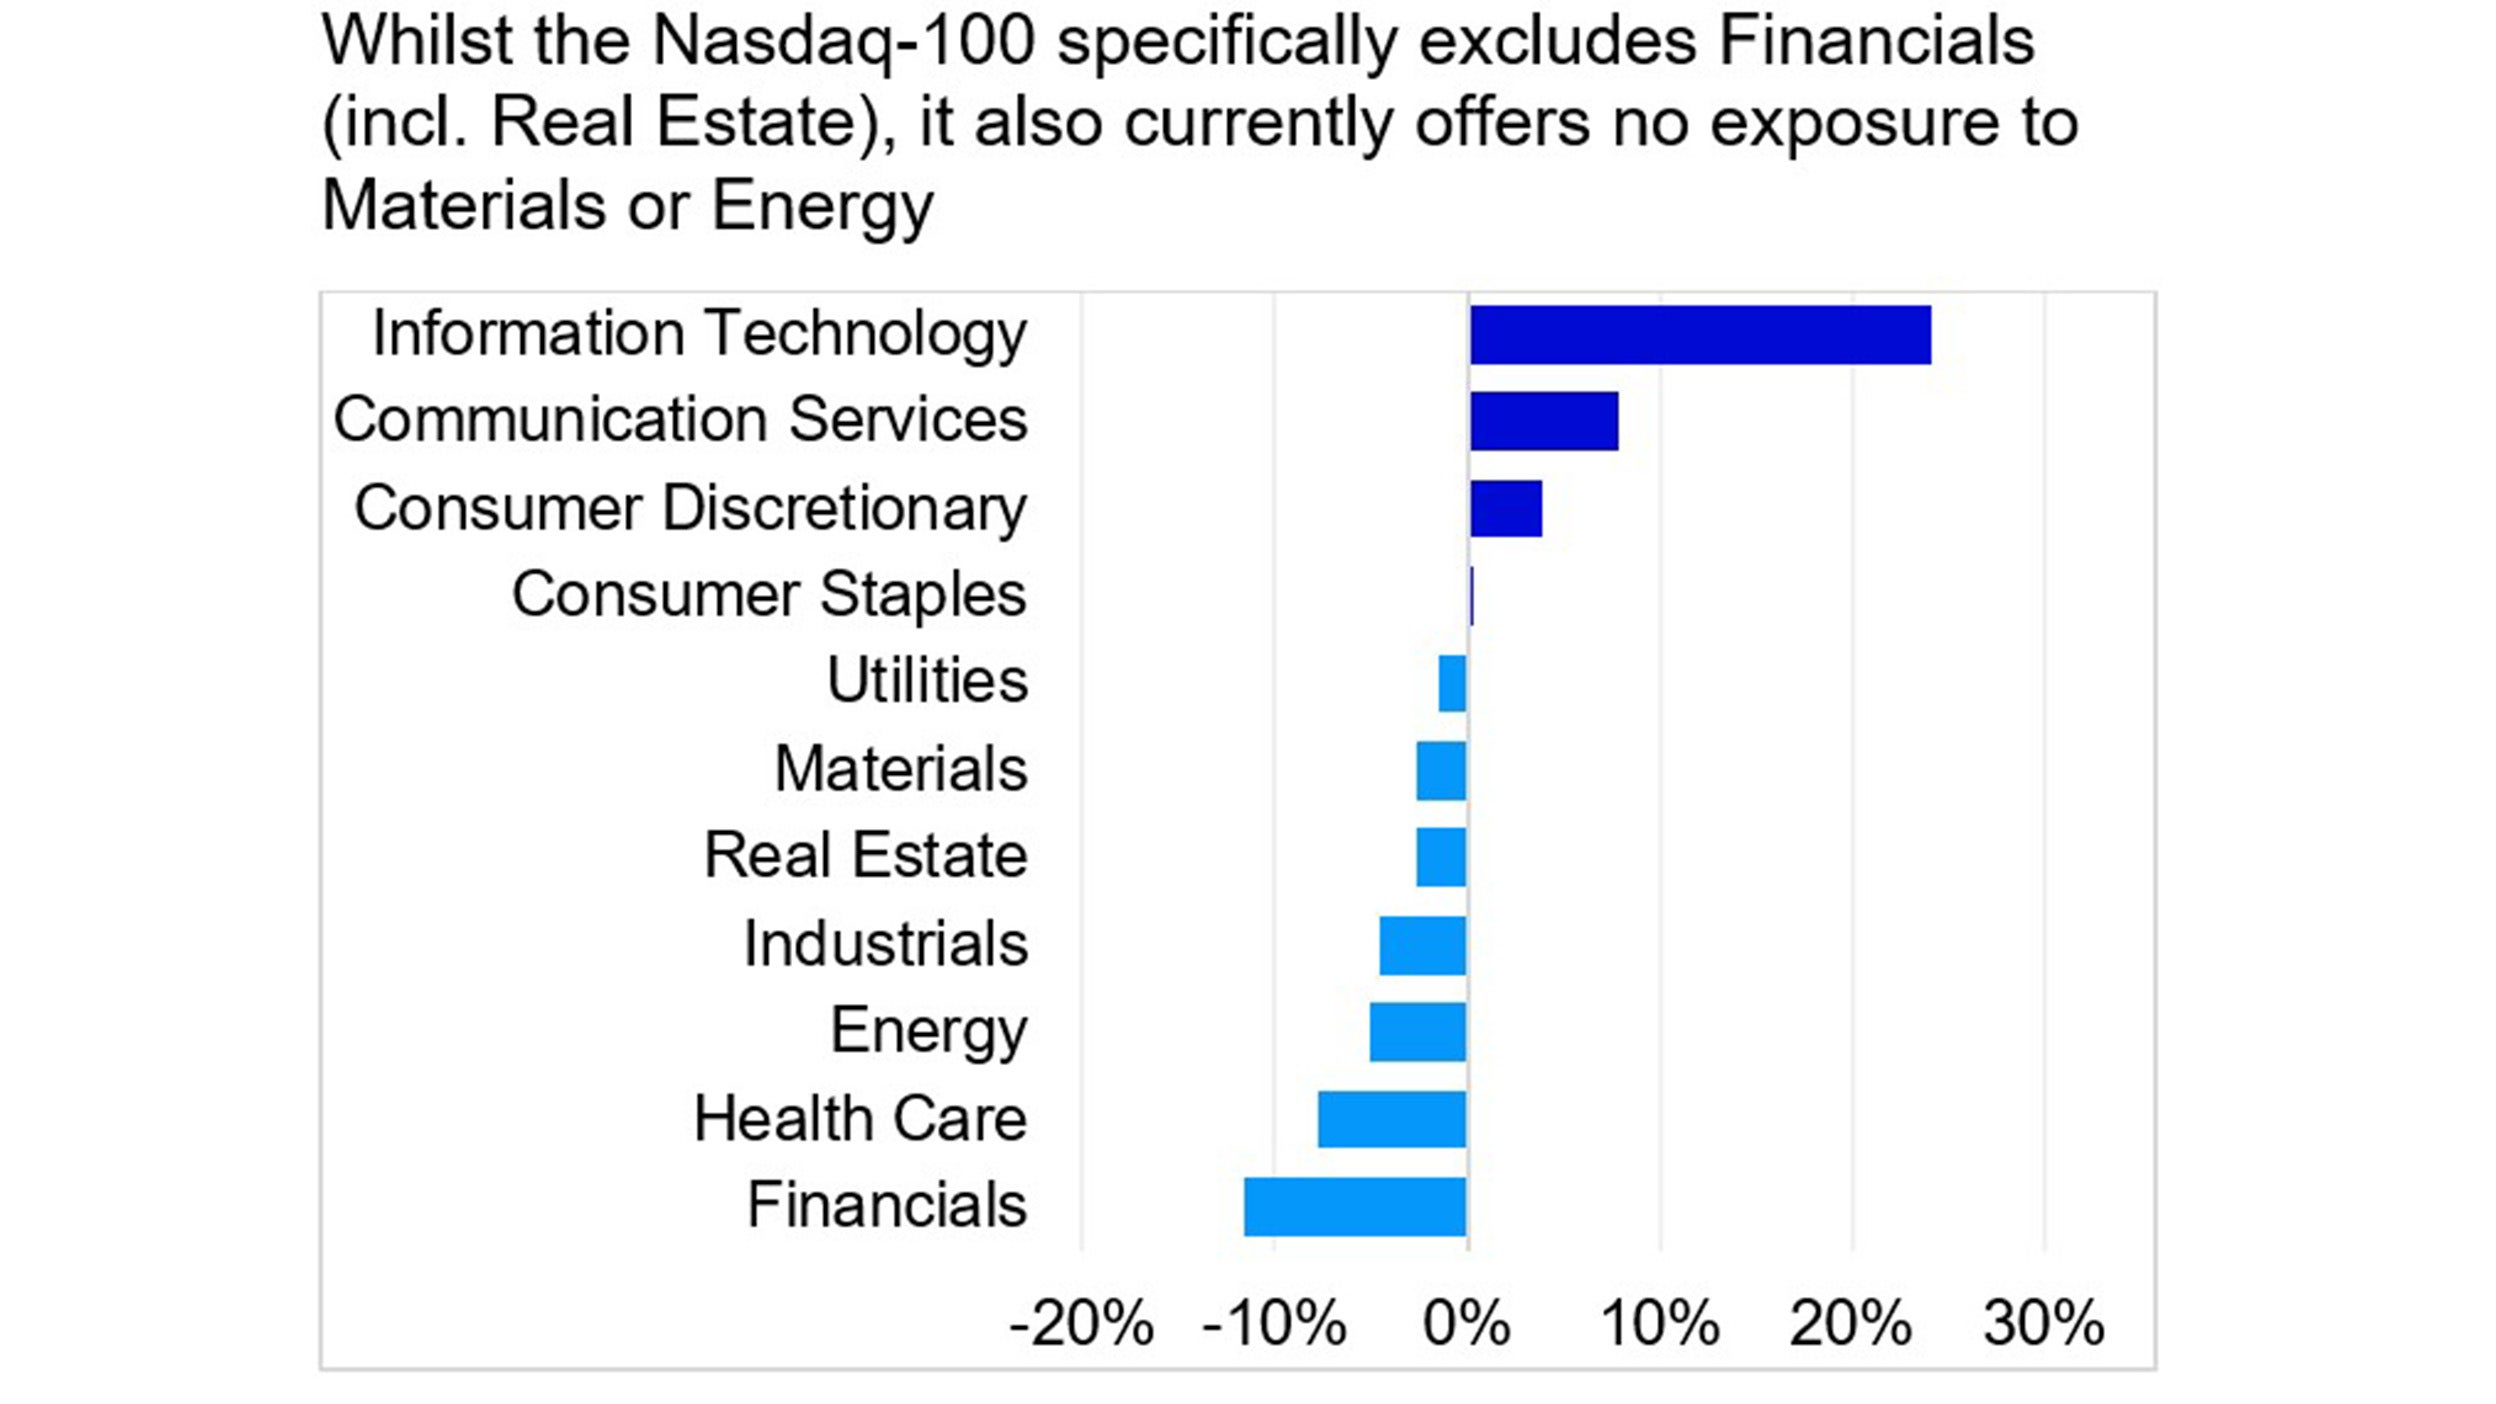
Relative to the S&P 500, the Nasdaq 100 outperformed slightly with 6 bps of excess return. The largest contributor to the Nasdaq 100's performance was the overweight in the Information Technology sector, which returned 6.1% in November. Lack of exposure to the Energy sector also contributed to relative performance. The Nasdaq 100's overweight to the Communication Services sector bolstered return as well with +72 bps, while its higher allocation to Consumer Discretionary companies detracted 56 bps from performance.
Chinese companies had a strong month of performance with three out of NDX’s five Chinese stocks posting the top performance in the index. The other two Chinese companies also performed well. Chinese stocks have struggled in 2022 due to the stringent and ongoing “Zero-COVID” policy the Chinese government has had in place. The turnaround in Chinese stocks were driven by comments made from the Chinese government that easing of Zero-COVID policies may be arriving soon. These comments came shortly after protests erupted against the strict policy in several cities in the country.

Data: Invesco, FactSet, as of 30 Nov 2022. Data in USD.

Source: Bloomberg, as of 30 Nov 2022. Top and bottom 3 performers for the month by absolute returns.

Data: Invesco, Bloomberg, as of 30 Nov 2022. Data in USD. Returns may increase or decrease as a result of currency fluctuations.
An investment cannot be made directly into an index.
Investment Risks
The value of investments and any income will fluctuate (this may partly be the result of exchange rate fluctuations) and investors may not get back the full amount invested.


