
The case for senior loans - quarterly update

Q3 2025 market update
Investors are increasingly reassessing the health and positioning of the bank loan asset class amid a backdrop of macroeconomic uncertainty and headline-driven volatility. Recent events such as the high-profile default of First Brands have amplified concerns around credit risk and the resilience of corporate issuers. While these developments have sparked debate, we believe these reflect idiosyncratic issues rather than systematic risk. Against this backdrop, three key questions have emerged:
1) How are underlying bank loan issuers performing in the current market?
2) What is the impact of falling interest rates on loan returns?
3) What is the outlook for the loan asset class?
This piece provides our view on the current market environment and attempts to answer these critical questions.
Why loans now?
In our view, there are three compelling reasons to consider investing in senior secured loans today:
1) Potential high level of current income
Current income is comprised of two key components—base interest rates (which are expected to stay higher for longer) and credit spreads (which have continued to remain wide). Coupon income for bank loans has been 7.67%, which remains well above the long-term average1. Market expectations are for rates to remain higher for longer, well above pre-2022 levels. Loans have proven to provide consistent, stable income through varying market cycles, including recessionary periods and periods of falling rates.
2) Resilience to interest rate changes
Bank loans are uniquely positioned in today’s market to deliver high income regardless of the direction of interest rates. As floating-rate instruments, their coupons reset regularly to SOFR helping insulate investors from the price volatility that affects traditional bonds. Whether rates rise or fall, loan prices are not directly linked to interest rate volatility and continue to generate attractive income.
Importantly, interest rate movements are notoriously difficult to predict. As a floating rate asset class, when rates rise, coupons increase; when rates fall, loans reset lower but still offer competitive yields relative to other fixed income segments such as high yield bonds. Moreover, declining rates ease interest express burden on borrowers, improving issuer fundamentals and reducing default risk. This flexibility makes loans a reliable source of income in both rising and falling rate environments, making this worth considering in portfolios.
3) Compelling relative value
Loans have consistently provided some of the most attractive yields in the fixed income market, while also offering downside risk mitigation due to their senior position in the capital structure and being secured by a company’s assets.
This year, high yield bonds have outperformed loans, largely driven by the longer duration of high yield bonds benefiting from rates falling1,2. However, much of that duration trade is now priced in. High yield bond spreads have compressed to historically tight levels limiting forward return potential. In contrast, loan spreads remain near their long-term averages, and loans continue to trade at a discount, creating an appealing entry point and price-upside potential as spreads normalize.
Loans also offer these high yields with potentially lower risk. In a recessionary scenario, loans provide further downside risk mitigation due to their senior secured status, which gives them the highest priority for repayment in the event of default. Historically, this seniority has translated into stronger recovery rates and lower credit losses during economic downturns reinforcing their role as a resilient asset class with historically positive annual returns.
Yields
Current loan yields and spreads look very attractive both on a historical and a relative basis. A loan's yield is based on both coupon payments, which is the interest return, as well as on principal return. The average coupon for loans is 7.67%1, outpacing the average high yield coupon of 6.55%2. After averaging around ~170 bps less than high yield bonds over the past fifteen years, this is the first time in history the average loan coupon has surpassed that of high yield bonds. It was only around four years ago when loans were yielding ~4.80%; loans recently have been yielding ~300 basis points more than that1.
A unique combination of appealing characteristics

Source: 1S&P UBS Leveraged Loan Index data through December 31, 2024, updated annually. *Denotes returns in excess of the axis. 2008 returns were –28.75%, 2009 returns were 44.87%.

Source: PitchBook Data, Inc. as of September 30, 2025, updated quarterly. Base rate reflects the average during the quarter. Uses three-month LIBOR (prior to 2023) or SOFR (2023 or later) plus the weighted average institutional spread. (Purple) Forecasted coupon for future rolling 3-month data as applicable using average trailing 4 quarters spread levels and forward 3m SOFR rates as of September 23, 2025. 2025-2028 represented by the forecasts as of September 23, 2025. With dashed purple line representing average projected coupon in 2025-2028. There can be no assurance that any projected coupons can be realized.
Since 2022, loans have been one of the best-performing asset classes—mitigating downside risk in 2022 and benefiting from rising rates in 2023—resulting in two of the strongest years for the asset class since the Global Financial Crisis3. The US leveraged loan market returned 9.05% in 20241. Loans have offered amongst the highest yields in fixed income and are expected to remain elevated as the market anticipates a higher for longer interest rate environment4.
Steady US loan returns stood in stark contrast to other risk assets

Sources: PitchBook Data, Inc.; Bank of America Merrill Lynch; Bloomberg as of September 30, 2025. The S&P UBS Leveraged Loan Index represents US Loans, the Bloomberg US Corporate HY Index represents US High Yield, the Bloomberg US Corporate IG Index represents US Investment Grade, the Bloomberg US Treasury Index represents Treasury. An investment cannot be made directly in an index.
While high yield bonds have outperformed loans by roughly 200 basis points year-to-date, much of that upside may already be priced in the market. The duration trade has largely run its course, and looking ahead, we believe senior loans may be better positioned to deliver higher income especially since forecasting interest rate moves remains inherently difficult. Loans’ floating rate structure offers built-in flexibility making loans a strategic component in diversified portfolios particularly when the direction (and magnitude) of interest rates are uncertain.

Source: S&P UBS Leveraged Loan Index & Bloomberg US Corporate High Yield Index data through September 30, 2025. An investment cannot be made in an index. Past performance is not a guarantee of future results. Estimated duration return based on modified duration as of prior month end and basis point change in yields of 5-year treasuries. 1S&P UBS LLI index data as of September 30, 2025.
Forecasting is hard, especially about the future

Source: Invesco, Bloomberg, as of August 1, 2025. For illustrative purposes only. Solid line represents actual Fed funds rate while dotted blue lines represent point in time historical forecasts.
Market technicals
Last year and earlier this year, we saw retail demand for loans soften amidst broader risk-off investor sentiment. However, that trend has abated as some investors are becoming more comfortable with the “soft-landing” scenario for the US economy and higher for longer interest rate narrative that can benefit loan investors. There has also been a flow of new CLO creations through 2024 and 2025. This indicates that there is still institutional investor appetite for loans. This steady CLO formation helped support the loan market technical despite retail outflows and macro concerns, with CLOs representing over 70% of the investor base in the loan market.3 After new issuance of CLOs recorded its 2nd highest year on record in 2024 (just behind 2021), this pacing continues in 2025 with 312 CLOs pricing over $200B as of September 30, 2025.1 CLOs continue to be the major source of institutional demand. Moreover, as demand for loans wanes, new loan issue supply will typically respond in kind to help re-establish equilibrium in the market. For example, year-end 2023 net issuance was $88.04bn, which is -50% year-over-year3. This supply/demand imbalance forces CLOs to provide a bid in the secondary market.
Relative valuations also favor bank loans compared to high yield bonds. Loan spreads are currently near their long-term average, while high yield bond spreads are at their tightest (expensive) since 2009. Loans have also been outyielding high yield bonds with loan coupons being historically high.
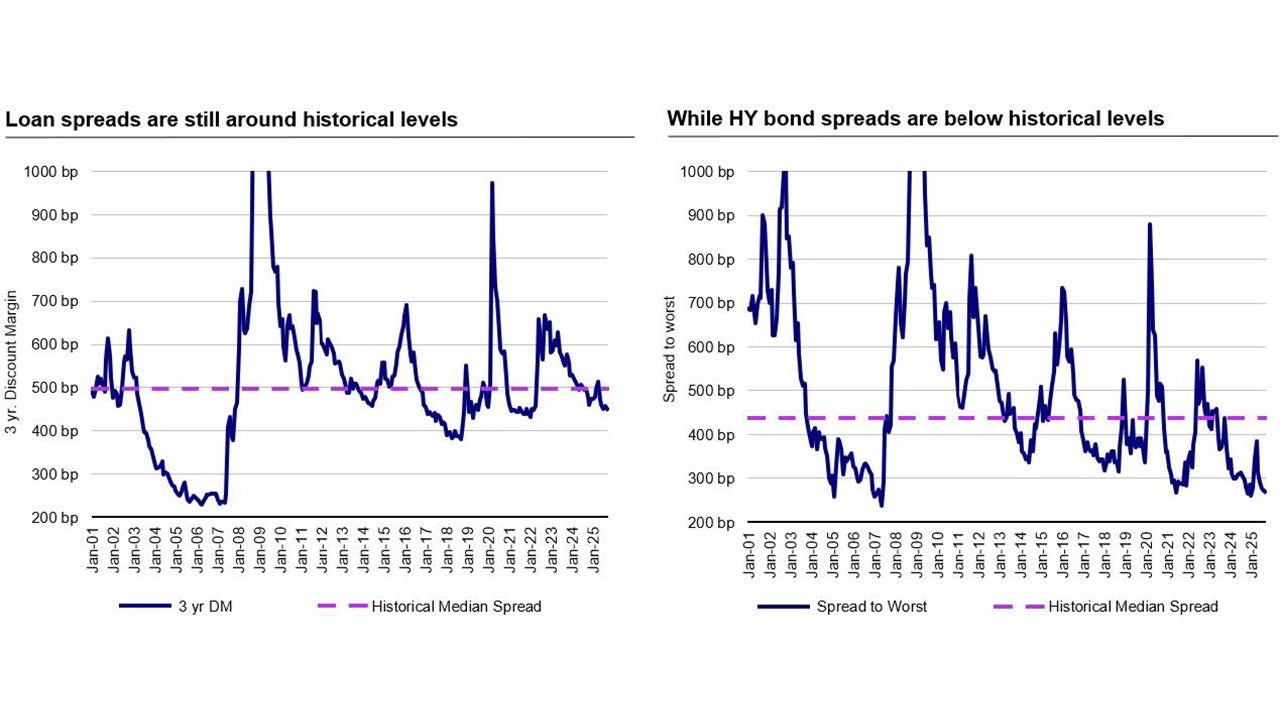
Source: S&P UBS Leveraged Loan Index & Bloomberg US Corporate High Yield Index as of September 30, 2025. Past performance is not a guarantee of future results. Long term medians based on data starting from 01/31/2001. *Peak Senior loan 3yr DM of 1799 on 12/31/08 and HY spread of 1833 on 11/28/08.
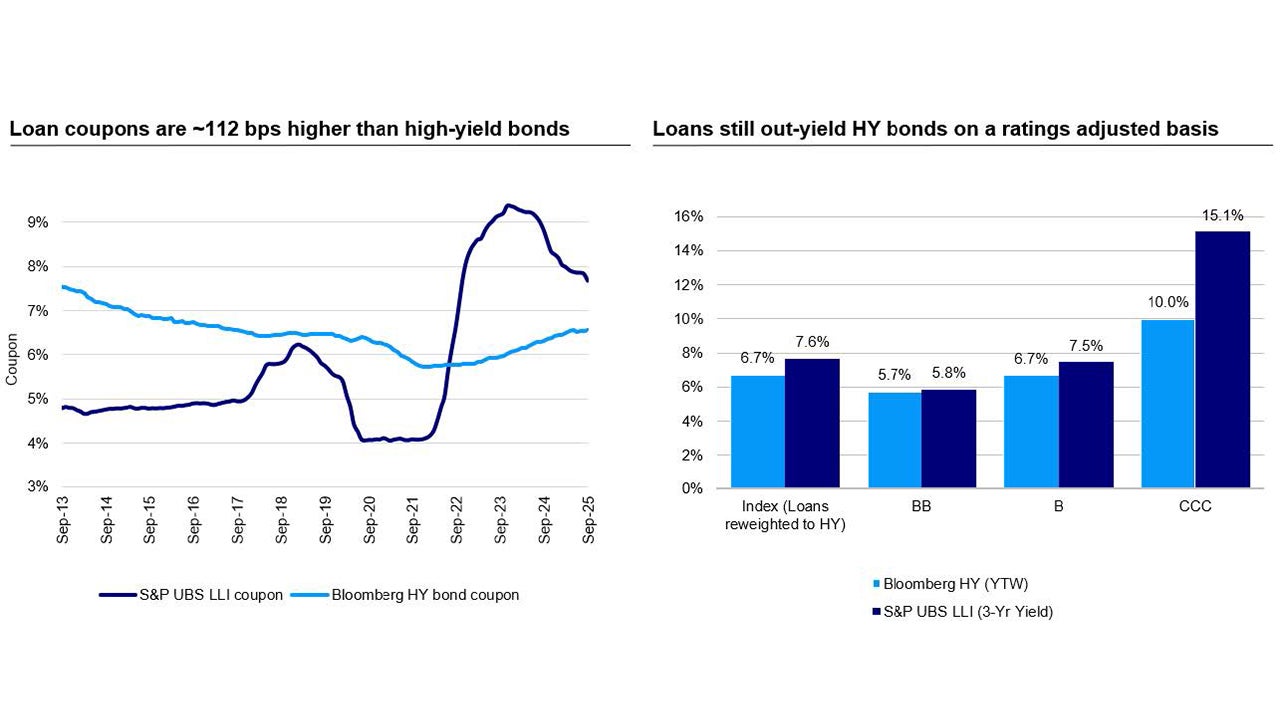
Sources: S&P UBS Leveraged Loan Index & Bloomberg US Corporate High Yield Index as of September 30, 2025.
Market fundamentals
While technicals are finding an equilibrium, market fundamentals for underlying loan issuers remain relatively strong.
Although First Brands’ credit default has drawn media attention, we view the event as idiosyncratic driven by aggressive and opaque financial practices specific to the issuer. In our view, it does not signal broader credit deterioration or systemic issues within the market. Although certain lenders have experienced material losses, the impact on the broader loan market has been limited. We continue to hold a constructive outlook for loans supported by strong and resilient credit fundamentals.
The US trailing twelve-month default rate including distressed exchanges at the end of September 2025 was 4.22%.3 While the risk of defaults remains the largest risk to loan investors, it is important to note that defaults are expected to have peaked and have been falling throughout the year. Additionally, the senior secured nature of loans has historically provided a high recovery rate in the event of default. Furthermore, firms that go through liability management exercises tend to have higher recovery rates compared to those that do not.
We still see the risk/return opportunity stronger in the loan market than in high yield which has seen spreads compress this year. The average leverage of companies in the leveraged loan market serves as an indicator of the financial health of bank loan issuers. The majority of borrowers continue to have healthy balance sheets, and average leverage in the market has returned to pre-pandemic levels. Borrowers have also pushed out their debt maturities with fewer than 1% of loans maturing in 2026. This leaves little refinancing risk in the market3.
Another important investor concern is how current rates will impact issuers’ ability to service their debt. The average borrower has entered this cycle with a very strong ability to service their debt. Interest coverage ratios have remained robust and are now improving as rates decline, indicating that companies continue to have sufficient capacity to meet their interest obligations. We expect these ratios to strengthen further throughout the remainder of 2025 and into 2026.
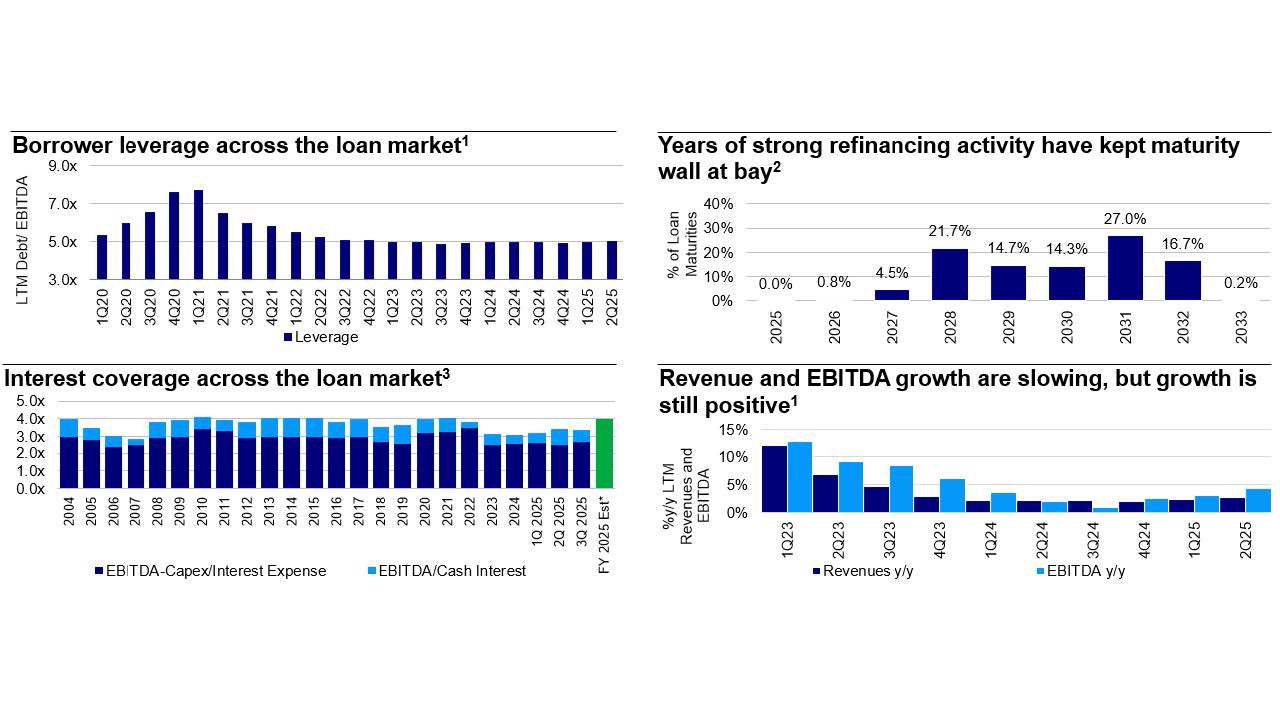
Sources: 1JPMorgan as of June 30, 2025 (data is last 12 months); data is quarter lagged. 2PitchBook Data, Inc., as of October 3, 2025, updated quarterly. 3PitchBook Data, Inc. Interest coverage ratios of leveraged loans. Data through September 30, 2025. *Based on Barclays estimates, a 1% interest rate cut results in a 0.8x increase in interest coverage ratios.
Conclusion
As we look ahead to 2026, we believe senior secured loans remain well positioned to deliver attractive risk-adjusted returns. While the broader credit landscape continues to evolve marked by shifting interest rate expectations, tighter spreads, and headline-driven volatility, loans offer compelling value through high income, discounted entry points, and resilient credit fundamentals.
As of September 30, 2025, loans have delivered a year-to-date return of 4.63% fueled by 6.04% interest return and offset by -1.34% principal return1. This highlights the asset class’s ability to generate meaningful income even in a volatile price environment. While total returns may moderate as interest rates drift lower and spreads compress, coupons are projected to remain above historical averages.
We believe the story of fixed income returns going forward is carry, not duration. With many loans trading at a discount to par, investors also have the potential to benefit from capital appreciation as loans mature at face value making now a potentially opportune time to invest in the asset class.
For investors seeking stability, yield, and resilience across market cycles, senior secured loans may continue to stand out as a strategic allocation. Loans have historically proven resilient across a range of economic environments offering an evergreen option for investors navigating market fluctuations. The recent default of First Brands, while notable, highlights the strength of the broader loan market demonstrating that isolated credit events do not necessarily signal systemic weakness. As shown below, declines in loan values have typically been short-lived. Regardless of idiosyncratic credit disruptions or a shifting interest rate environment, the loan asset class has consistently delivered attractive returns for investors.
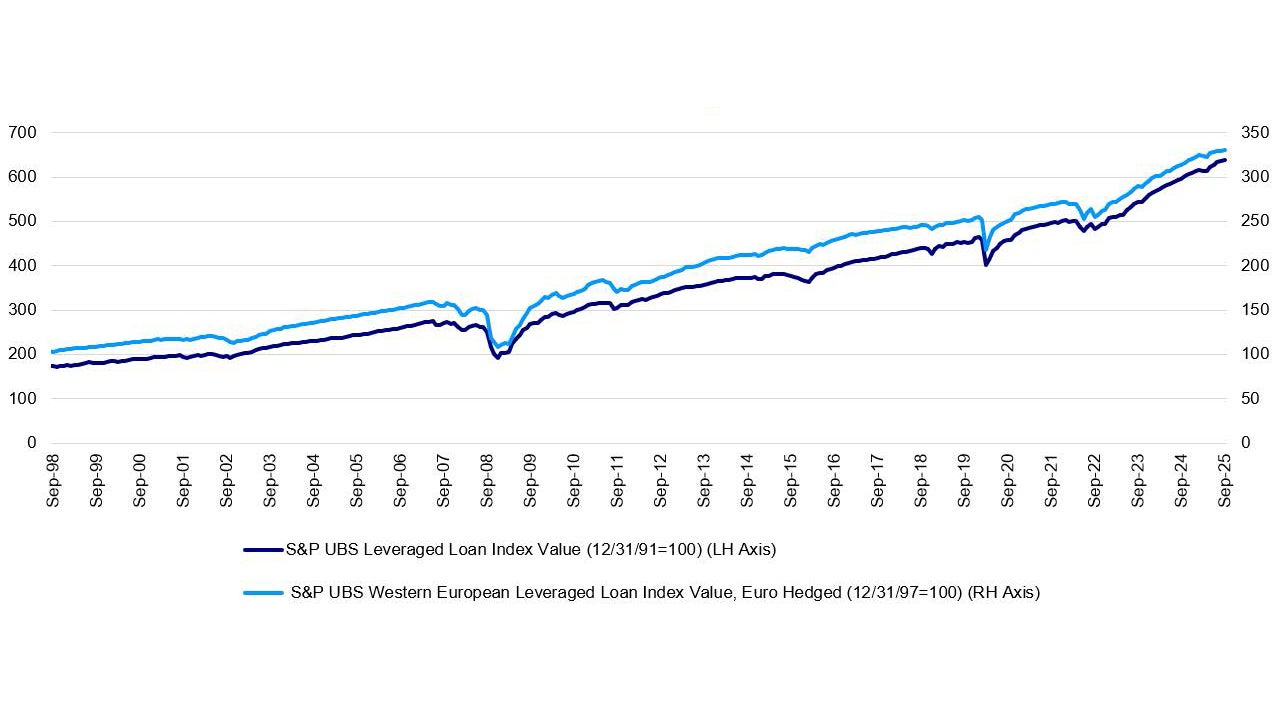
Source: S&P UBS as of September 30, 2025.
Investment risks
Many senior loans are illiquid, meaning that the investors may not be able to sell them quickly at a fair price and/or that the redemptions may be delayed due to illiquidity of the senior loans. The market for illiquid securities is more volatile than the market for liquid securities. The market for senior loans could be disrupted in the event of an economic downturn or a substantial increase or decrease in interest rates. Senior loans, like most other debt obligations, are subject to the risk of default. The market for senior loans remains less developed in Europe than in the U.S. Accordingly, and despite the development of this market in Europe, the European Senior Loans secondary market is usually not considered as liquid as in the U.S. The value of investments, and any income from them, will fluctuate. This may partly be the result of changes in exchange rates. Investors may not get back the full amount invested.


