Uncommon truths: Where will we gather new assets?

Our analysis suggests that annual global savings could more than double in real terms over the next 50 years. The US, China and India are deemed likely to be the sources of the biggest savings pools. Demographics could see the role of Europe diminish (though it will remain important), while boosting the role of Africa (from a low base).
This is the next in a series of papers over the summer about long-term issues. The topic is savings patterns and the link to demographics, development and lifecycle patterns of saving. The conclusions should be of interest to asset managers wondering where to look for clients over the coming decades.
An obvious place to look for savings flows is in countries with lots of savers. The answer will lie somewhere in the intersection between population size, income per head of population, and the share of population that is in the saving phase of life. The latter is on the assumption that we save while working to accumulate wealth that can be used when we retire – the life cycle hypothesis of savings (there is a short selection of suggested reading material about the life cycle hypothesis in the bibliography, for those who are interested). The focus is implicitly on private sector pension-type savings. Public sector funds that perform broadly the same function (sovereign wealth funds, say) could also be considered but they are much easier to identify and are not the topic of this paper.
Figure 1a shows the distribution of regional populations across the age spectrum (as of 2025, according to United Nations forecasts). A number of messages emerge from this chart: first, Asia has by far the largest population of the regions covered, accounting for 59% of the world’s population in 2025 (Asia includes both China and India). Second, Africa’s population is relatively young, whereas Europe’s is relatively old (Asia’s population is somewhere between Africa and Europe when it comes to age distribution).
To complete the picture, Figure 1b shows how the age distribution of Europe’s population has and is expected to develop over time. There is a similar pattern for North America, South America and Asia, with the post-war baby boom creating a population hump that is moving through the age range as time passes. That population hump has been in the savings intensive age range (which I take to be 25-60), but is expected to soon pass into the dissaving (retirement) phase of life. That could have profound implications for the global flow of savings and where those savings are likely to be located.
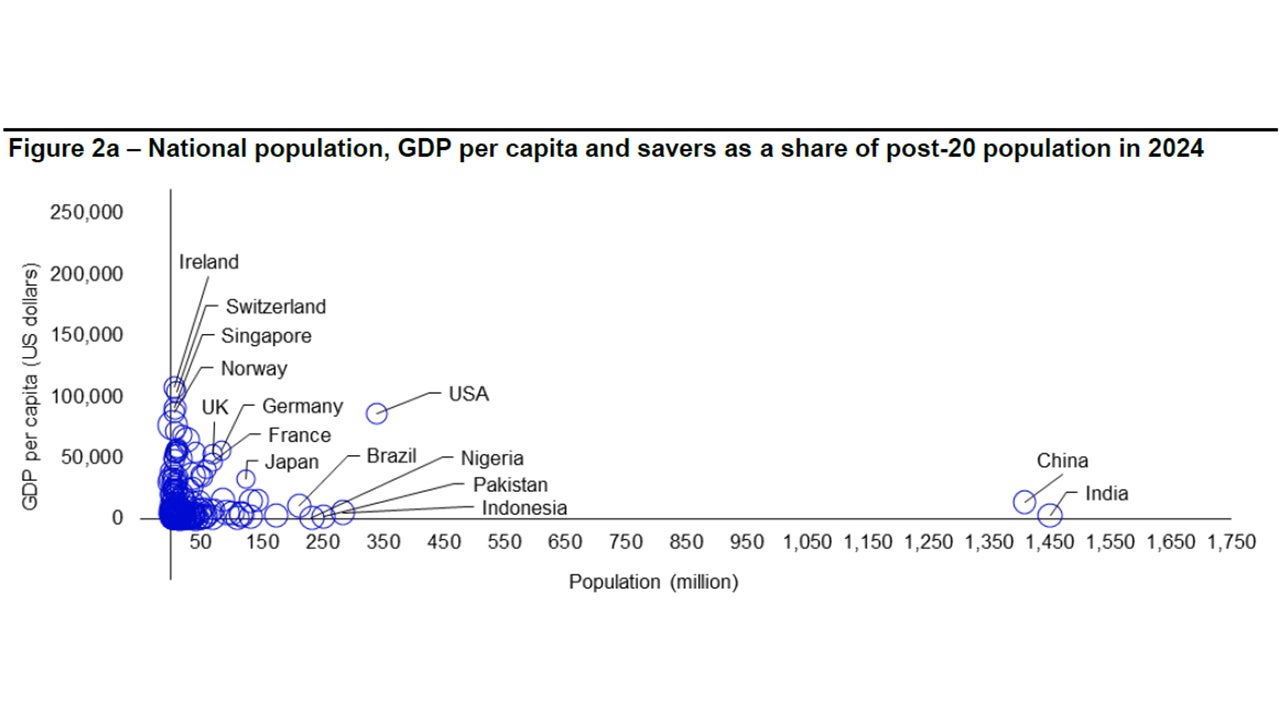
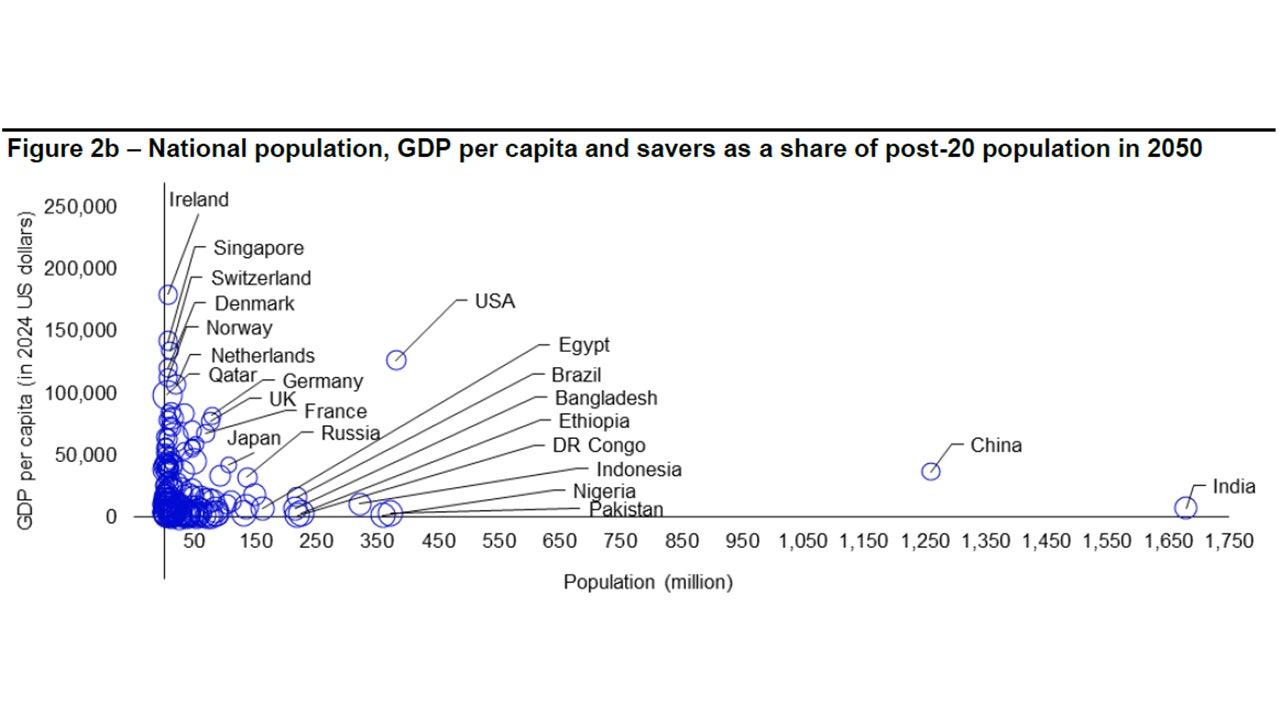
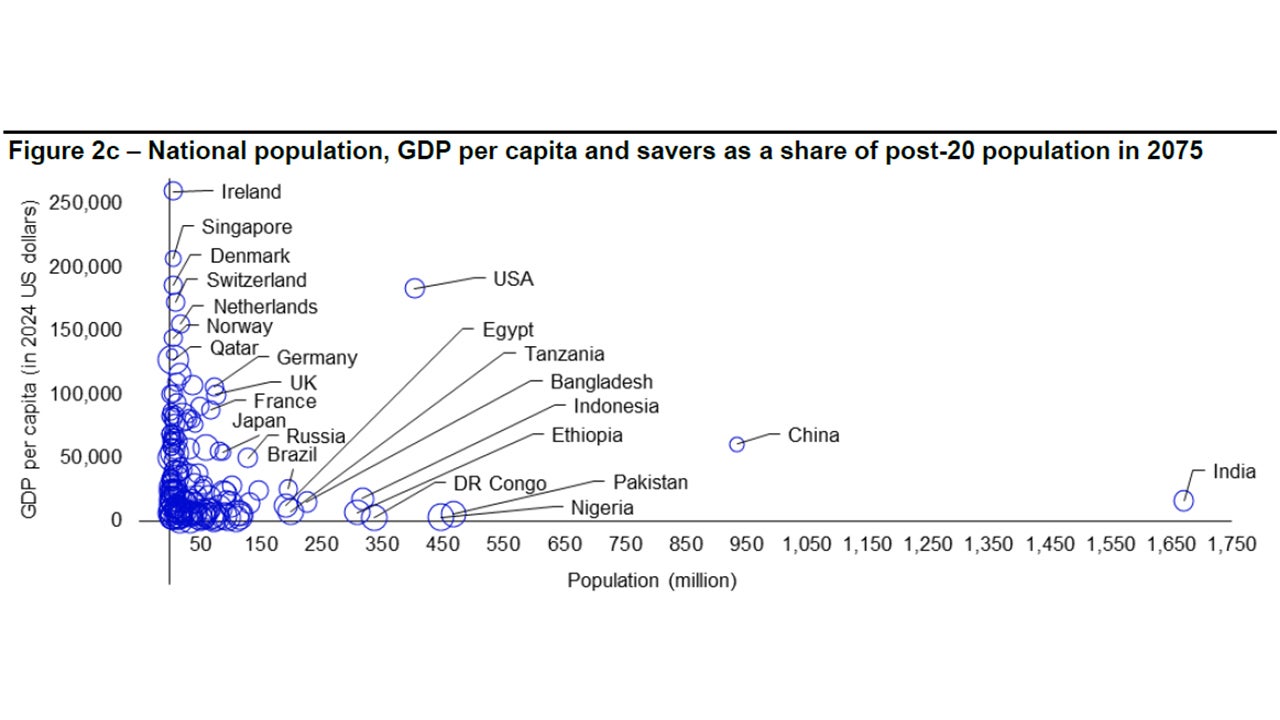
The next consideration is income. Figures 2a, 2b and 2c show how population and income per capita are forecast to evolve over the coming fifty years for around 160 countries (those with population below one million are excluded). The population estimates are taken from the United Nations World Population Prospects 2024 dataset (note that the size of the bubbles is in proportion to the 25-60 year age group as a share of the total 20-plus age group, to capture the share of “savers” within the adult population). Income per capita forecasts are based on World Bank 2024 data and our projections for real growth over the periods considered (using a combination of historical growth patterns and the notion of convergence). The highlighted countries are at the upper extremes of population or income per capita (or both), which suggests the potential for high savings volumes.

Note: Based on United Nations (UN) estimates up to 2023 and UN Medium Variant forecasts thereafter. The horizontal axes show the centre point of the five year age ranges for which population is shown. Shaded areas show the 25-60-year age range, which is chosen to represent the part of the average person’s life cycle in which they accumulate most savings, thus enabling dissaving in later life.
Source: United Nations World Population Prospects 2024 and Invesco Global Market Strategy Office.


Note. Population data is based on United Nations World Population Prospects (2024) and the size of the bubbles is in proportion to population of the 25-60 age range as a share of the 20-plus age group (designed to show the share of savers in the post-20 age group). GDP per capita in 2024 shows World Bank data in US dollars. GDP per capita for 2050 and 2075 is expressed in 2024 prices and is based on our own projections of real GDP growth (using constant growth for the 2024-50 and 2050-2075 periods, based on historical trends and assumptions about some convergence of income across countries). “DR Congo” is the Democratic Republic of the Congo. “UK” is the United Kingdom. “USA” is the United States of America. Source: World Bank, United Nations World Population Prospects (2024) and Invesco Global Market Strategy Office.
The first point worth noting in those charts is how well the US is placed, with the ideal combination of a large population and high income per capita. No wonder the US has such a large financial services sector. Comparing the charts, it appears the US will continue to enjoy this advantage. However, with the passage of time, the size of the US bubble is expected to decrease, suggesting that the share of the adult population in the peak-saving age range will diminish.
China and India are notable for the size of their populations. However, they are expected to diverge over the coming decades, with UN projections suggesting the population of India will rise, while that of China will fall (though still remaining well above that of any country outside India). The problem for these two countries is the limited income per capita, though our estimates suggest they will improve on this score (we expect India to enjoy better growth but the lower starting point disguises that fact in the charts).
Some European countries (and Singapore) have the opposite problem, with high income per capita but very small populations. Germany, France and the UK enjoy high income and reasonably sized populations but demographic trends could be challenging over the next 50 years (and the importance of high savers within those populations is expected to diminish).
Going in the opposite direction are a range of African countries, with populations expected to grow rapidly, taking many above European nations and some above the US. Today, Nigeria is the obvious large population African country, with a headcount of 232 million in 2024. That is expected to grow to around 447 million by 2075. The populations of DR Congo and Ethiopia are expected to be above 300 million by that point, while those of Egypt and Tanzania are expected to be near 200 million. Unfortunately, per capita incomes are expected to continue lagging well behind China and India, let alone Europe and the US.
So, where will the savings of the future come from? Figures 3a and 3b show our attempt to quantify this. We do not calculate projected savings but rather focus on “savings potential”, which we define as GDP (the product of forecast population and forecast GDP per capita), multiplied by the share of the post-20 year old population accounted for by those in the prime savings age range (25-60). The good news for asset gatherers is that our projections suggest global savings could increase by two-thirds in real terms by 2050 and more than double by 2075 (from 2024). Figure 3a suggests that Asia (including China and India) will continue to dominate, accounting for around 40% of the global savings potential over the next 50 years. North America (including the US) is next, with a relatively stable 25%-27% share, while Europe’s share is expected to decline from 24% to 19% (Latin America’s share is also expected to decline). Our forecasts suggests the slack will be taken up by Africa, with its share rising from 3% to above 8%.
Figure 3b suggests that among nations, the US will continue to be important. In fact the top-5 nations in 2075 are expected to be the same as in 2025. But the share accounted for by China and major European nations is expected to fall, with the slack largely taken up by India. Though African countries are expected to move up the rankings, they will continue to fall short of the top-10 (Egypt, Ethiopia, South Africa and Tanzania are expected to move into the top-30).

Note: “Share of global savings potential” is constructed as the product of population, GDP per capita and the 25-60 population share of total 20-plus population, divided by the global savings potential. Population projections are taken from the United Nations World Population Prospects 2024 dataset (Medium Variant). GDP per capita is based on World Bank data for 2024 GDP per capita in US dollars, with our own forecasts for inflation-adjusted growth for years after 2024. Figure 3a shows annual data from 2025 to 2075. “Asia” uses the countries in the United Nations’ (UN) Asia-Pacific categorisation, “Europe” includes both East and West Europe and “Lat Am” follows the UN’s Latin America and Caribbean definition (and includes Mexico). Figure 3b shows the ten countries that are projected to have the largest share of global savings potential in 2075. Source: United Nations World Population Prospects 2024, World Bank and Invesco Global Market Strategy Office.
Of course, these calculations are just the starting point and the forecasts can no doubt benefit from more detailed consideration of potential growth in GDP per capita, for example. They also ignore differences in national savings behaviour, income distribution and pension systems.
Further analysis can allow for such factors but we can already imagine some ways in which those savings potential calculations could be misleading. First, savings rates vary enormously by country, so that actual savings may deviate from what our savings potential numbers suggest. For example, the US may have the highest savings potential but its gross savings/GDP ratio was only 18% in 2024 and has rarely been above 20% since 1980 (according to IMF data), while that of China was 43% and has been above 40% since 2003. Though the US appears to have greater savings potential than China, that seems unlikely to translate into an actual savings advantage. Indeed, World Bank data suggests that China’s gross savings (in US dollars) exceed those of the US, by some margin.
For comparison purposes, India’s savings rate has been above 30% for most of this century, while Japan’s has largely been in the 25%-30% range and that of the EU has been in the 20%-25% range. The savings rates of African nations vary enormously from -12% in Malawi to 40% in Nigeria (in 2024) and can be expected to change radically as they develop.
Another factor worthy of consideration is income distribution. It could be argued that an unequal distribution may lead to more aggregate saving (how much can one individual spend?). However, for the purposes of considering where asset managers are likely to be able to tap into savings pools, I suspect that a more equal distribution of income will give more opportunities. Comparing the income distribution of the US to Europe and Japan, the former has a less equal distribution, with a Gini coefficient of 41.8 in 2023 (according to World Bank data), compared to 31.2 in France (2022), 32.4 in the UK (2021), 32.4 in Germany (2020) and 32.3 in Japan (2020). A higher Gini coefficient implies greater inequality. Is it mere coincidence that greater income inequality in the US is associated with a lower national savings rate? For comparison purposes, China’s Gini coefficient was 35.7 in 2021, while that of India was 25.5 in 2022.
It is more difficult to allow for differences in pension systems. For example, it might be assumed that in countries with public sector pension systems there may be less need to save out of after-tax income. However, properly accounted for, savings in such countries may follow the pattern suggested by the life cycle hypothesis (see, for example, the paper by Jappelli and Modigliani mentioned in the bibliography).
Overall, my conclusions are that global savings will grow strongly over the coming decades, as the world’s population expands and incomes increase (especially in developing countries). I expect that Asia, North America and Europe will continue to be the main sources of savings. Though the above analysis may overstate the role of the US (and understate that of China) as a source of savings, I believe that the US, China and India will be the three countries likely to generate most savings (and therefore potential for asset gatherers). Though remaining important, I believe the role of Europe will diminish, while that of Africa will grow. However, as a source of savings, Africa is likely to suffer from relatively low income per capita (even allowing for faster growth than elsewhere) and geographic and regulatory dispersion across 54 countries. The analysis suggests that Egypt, Ethiopia, South Africa, Tanzania, Nigeria and Kenya could offer the best potential but are geographically far apart in some cases. Ethiopia, Kenya and Tanzania may be the most promising contiguous grouping.
Unless stated otherwise, all data as of 22 August 2025.
Investment risks
The value of investments and any income will fluctuate (this may partly be the result of exchange rate fluctuations) and investors may not get back the full amount invested.


