Tactical Asset Allocation - August 2025

Synopsis
Our framework remains in a contraction regime for the 14th consecutive month. The latest US GDP and payroll reports confirm a clear slowdown in private demand and job growth. We maintain a defensive posture, overweighting fixed income relative to equities, favoring defensive sectors and a moderate underweight in developed ex-US equities and emerging markets. In fixed income, we maintain a moderate duration overweight and underweight credit risk. We remain positioned for US dollar depreciation.
Our research indicates that long-lasting contraction regimes in our framework have been historically accompanied by risk-off markets, with declining bond yields and equities underperforming fixed income, also outside recessionary episodes.
Slowing private demand, softening labor markets, and rising credit card delinquencies are sending warning signs. Maintaining defensive portfolio positioning, favoring fixed income over equities, underweight credit risk and overweight duration.
Our macro process drives tactical asset allocation decisions over a time horizon between six months and three years, on average, seeking to harvest relative value and return opportunities between asset classes (e.g., equity, credit, government bonds, and alternatives), regions, factors, and risk premia.
Macro Update: Private sector demand and labor markets are softening, and credit card delinquencies point to challenges ahead for consumer spending.
Our barometer of global risk appetite was broadly unchanged over the past month, and global growth remains stable, despite mounting evidence of slower underlying demand. Our macro framework remains in a contraction regime for the global economy for the 14th consecutive month, namely since July 2024, marking one of the longest contraction phases identified by our models since the 1980s (Figures 1 and 2). As a reminder, we define a contraction regime as a period of below-trend and decelerating growth, which includes recessions when growth turns negative. Looking at the performance of broad-based economic statistics, as well as the resilience of equity and credit markets, we can certainly say we are not in a recession today but, nonetheless, in an environment of below-trend and decelerating growth. In particular, the latest US GDP report shows economic growth averaged 1.25% in the first half of 2025, a percentage point cooler than the pace for 2024, and below the estimated trend-rate of approximately 2%. Abstracting from the volatility and distortion in trade and inventories caused by tariff uncertainty, economists are paying closer attention to final sales to private domestic purchasers, a narrower metric of demand. This measure rose at a 1.2% pace in the second quarter, the slowest since the end of 2022.

Sources: Bloomberg L.P., Macrobond. Invesco Solutions research and calculations. Proprietary leading economic indicators of Invesco Solutions. Macro regime data as of July 31, 2025. The Leading Economic Indicators (LEIs) are proprietary, forward-looking measures of the level of economic growth. The Global Risk Appetite Cycle Indicator (GRACI) is a proprietary measure of the markets’ risk sentiment. Developed markets ex-USA include the eurozone, UK, Japan, Switzerland, Canada, Sweden, Australia. Emerging markets include Brazil, Mexico, Russia, South Africa, Taiwan, China, South Korea, India.

Source: Invesco Solutions as of July 31, 2025.

Sources: Bloomberg L.P., Macrobond. Invesco Solutions research and calculations. Proprietary leading economic indicators of Invesco Solutions. Macro regime data as of July 31, 2025. The Leading Economic Indicators (LEIs) are proprietary, forward-looking measures of the level of economic growth. The Global Risk Appetite Cycle Indicator (GRACI) is a proprietary measure of the markets’ risk sentiment.

Sources: Bloomberg L.P., MSCI, FTSE, Barclays, JPMorgan, Invesco Solutions research and calculations, from Jan. 1, 1992 to July 31, 2025. The Global Leading Economic Indicator (LEI) is a proprietary, forward-looking measure of the growth level in the economy. A reading above (below) 100 on the Global LEI signals growth above (below) a long-term average. The Global Risk Appetite Cycle Indicator (GRACI) is a proprietary measure of the markets’ risk sentiment. A reading above (below) zero signals a positive (negative) compensation for risk-taking in global capital markets in the recent past. Past performance does not guarantee future results.
Consumer spending, which accounts for two-thirds of GDP, advanced 1.4%, improving from the sluggish 0.5% gain at the start of the year, but marking the slowest growth in consecutive quarters since the pandemic. Business investment expanded at a much slower pace in the second quarter, and residential investment declined an annualized 4.6%, the weakest pace since 2022, as potential homebuyers struggle with high borrowing costs. Tight credit conditions are also evident in the steady increase in credit card delinquencies over the past few quarters, which have now reached levels comparable to the 2008-2009 recession (Figure 3). Finally, the latest US employment report sent clear warnings of a meaningful deceleration in hiring across sectors, with substantial downward revisions to job growth estimates from prior months. Overall, underlying demand is undoubtedly growing below trend and decelerating, consistent with our definition of a “contraction“ regime, with an open question whether this deterioration will be significant enough to trigger a recession and risk-off markets in the near future, as per our portfolio positioning.
Is a recession a necessary condition for our contraction regimes to reward defensive portfolio positioning? The answer is no. We analyze the historical performance of our models during similarly prolonged contraction periods (12-months or longer) of below-trend and decelerating growth, but that did not coincide with a recession, specifically between March 1992 - May 1993, and June 2002 - May 2003. In both episodes, US equities underperformed US Treasuries by approximately 3% and 20%, respectively, and US 10-year bond yields declined by approximately 110 bps and 170 bps, indicative that similar environments of low and decelerating growth justify a reduction in portfolio risk, favoring bonds over equities, and a tilt to higher duration.1 In summary, our framework continues to identify a contraction regime, now approaching the longest duration recorded in our research, despite evidence thus far of no recession. Nonetheless, historical evidence suggests that a cautious investment posture is still warranted, and our asset allocation reflects this stance.

Sources: Federal Reserve Bank of New York Consumer Credit Panel/Equifax and authors’ calculations.
NOTES: Delinquency is defined as the share of credit card debt that is 90 days or more past due. Data are quarterly and composed of individuals ages 20 to 64. Data are based on a nationally representative, 5% random, anonymous sample of all those with a Social Security number and a credit report.

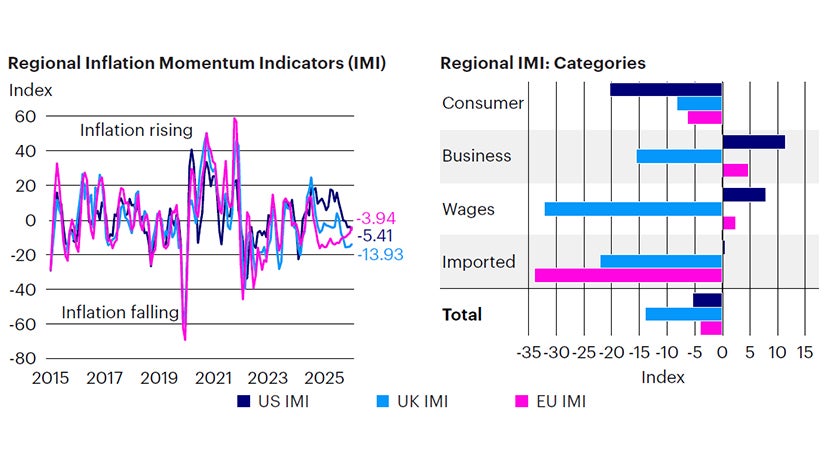
Sources: Bloomberg L.P. data as of July 31, 2025, Invesco Solutions calculations. The US Inflation Momentum Indicator (IMI) measures the change in inflation statistics on a trailing three-month basis, covering indicators across consumer and producer prices, inflation expectation surveys, import prices, wages, and energy prices. A positive (negative) reading indicates inflation has been rising (falling) on average over the past three months.
Investment positioning
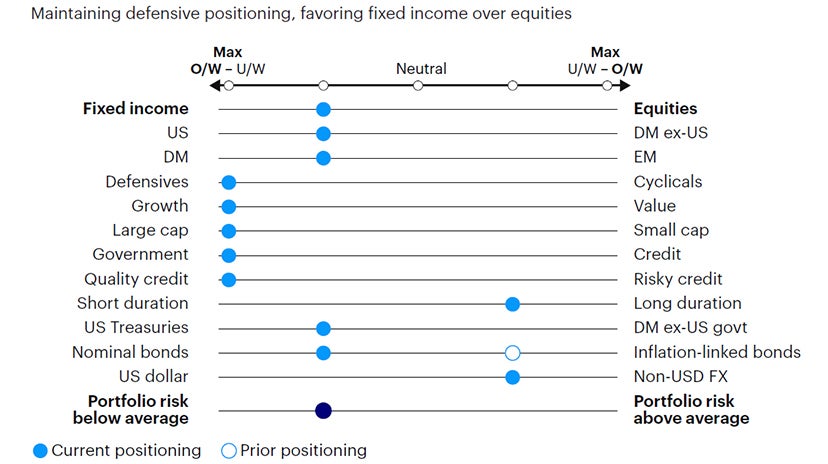
We implemented minimal changes this month in the Global Tactical Allocation Model.2 We remain underweight risk relative to benchmark, and underweight equities relative to fixed income, primarily via an underweight to emerging markets and developed markets outside the US. We overweight defensive sectors with quality and low volatility characteristics. In fixed income, we underweight credit risk3 relative to benchmark, overweight duration via nominal Treasuries, and underweight US TIPS on declining inflation momentum (Figures 4 to 8). In particular:
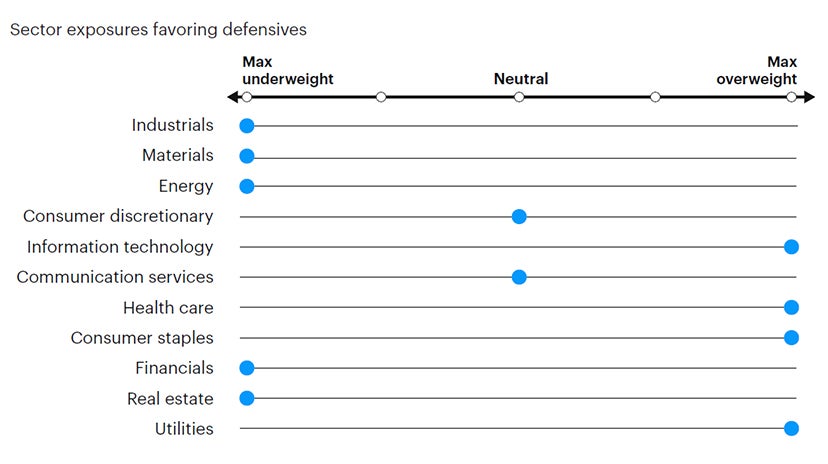
- In equities, despite ongoing US dollar depreciation, downward revisions in earnings expectations in Europe and Japan lead our models to remain underweight these cyclical markets more levered to global trade. The outperformance of international developed markets versus US equities has stalled since April. Similarly, we maintain a moderate underweight in emerging market equities relative to developed markets. We favor defensive sectors with quality and low volatility characteristics, tilting towards larger capitalizations at the expense of value, mid and small caps. Hence, we favor sectors such as health care, staples, utilities, and technology at the expense of cyclical sectors such as financials, industrials, materials, and energy.
- In fixed income, we underweight credit risk and overweight duration, favoring investment grade and sovereign emerging fixed income relative to high yield. Given the decelerating growth environment and historically tight spreads, we believe the risk-reward in this position is attractive. In sovereigns, we exited the overweight exposure to US TIPS and moved to a moderate overweight in nominal Treasuries, following declining inflation momentum (Figure 4).
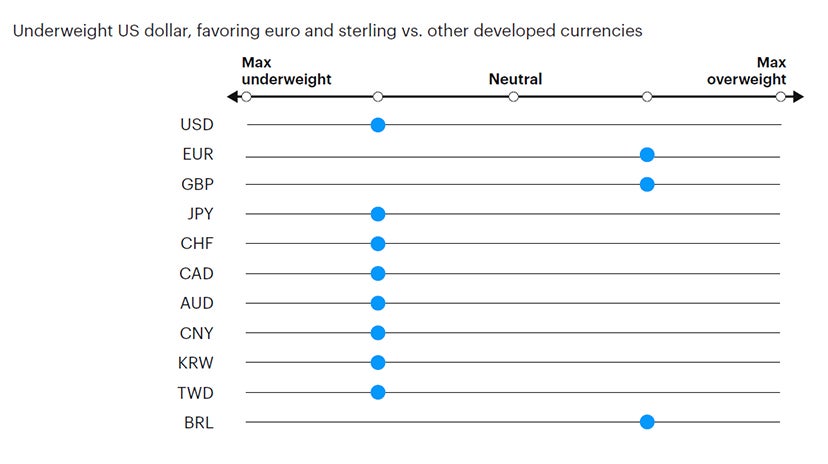
- In currency markets, we remain underweight the US dollar, driven by narrowing interest rate differentials relative to the rest of the world, and positive surprises in economic data outside the US. Concerns around the deteriorating fiscal position of the US, and rising funding requirements is adding to the negative sentiment towards the greenback. Within developed markets we favor the euro, the British pound, Norwegian kroner, Swedish krona, and Singapore dollar relative to the Swiss franc, Japanese yen, Australian and Canadian dollars. In EM we favor high yielders with attractive valuations, such as the Colombian peso, Brazilian real, Indian rupee, Indonesian rupiah, and Mexican peso, relative to low yielding and more expensive currencies, such as the Korean won, Taiwan dollar, Philippines peso and Chinese renminbi.

Source: Invesco Solutions, Aug. 1, 2025. DM = developed markets. EM = emerging markets. Non-USD FX refers to foreign exchange exposure as represented by the currency composition of the MSCI ACWI Index. For illustrative purposes only.

Source: Invesco Solutions, Aug. 1, 2025. For illustrative purposes only. Neutral refers to an equally weighted factor portfolio.

Source: Invesco Solutions, Aug. 1, 2025. For illustrative purposes only. Sector allocations derived from factor and style allocations based on proprietary sector classification methodology. As of December 2023, Cyclicals: energy, financials, industrials, materials; Defensives: consumer staples, health care, information technology, real estate, utilities; Neutral: consumer discretionary and communication services.

Source: Invesco Solutions, Aug. 1, 2025. For illustrative purposes only. Currency allocation process considers four drivers of foreign exchange markets: 1) US monetary policy relative to the rest of the world, 2) global growth relative to consensus expectations, 3) currency yields (i.e., carry), 4) currency long-term valuations.
Investment risks
The value of investments and any income will fluctuate (this may partly be the result of exchange rate fluctuations), and investors may not get back the full amount invested.


