Tactical Asset Allocation - June 2025

Synopsis
Cyclical regions, such as Europe and Japan, are levered to global trade and are experiencing a weakening of fundamentals and downgrades in earnings expectations.
Our framework remains in a contraction regime for the 12th consecutive month. We maintain a cautious asset allocation versus benchmark, overweighting fixed income relative to equities and favoring defensive sectors. We move to a moderate underweight in developed ex-US equities versus US equities on lower earnings expectations. In fixed income, overweight duration via inflation-linked bonds, and underweight credit risk.
Maintaining defensive portfolio positioning, favoring fixed income over equities, and underweighting credit risk. Downward revisions in earnings expectations across Europe and Japan, leading to a moderate underweight in developed ex-US equities relative to US equities.
Our macro process drives tactical asset allocation decisions over a time horizon between six months and three years, on average, seeking to harvest relative value and return opportunities between asset classes (e.g., equity, credit, government bonds, and alternatives), regions, factors, and risk premia.
Macro update
Instability in global trade policy continues to cloud the outlook. On May 28, the US Court of International Trade suspended the tariffs imposed by the US administration under the authority of the International Emergency Economic Powers Act (IEEPA). While countries around the world wait for the settlement of this dispute, likely driving the legal path of future trade negotiations, the economic and market reality remains unchanged. The US administration retains several channels of executive authority to implement their tariff agenda, including Section 301 and Section 122 of the Trade Act of 1974, or Section 891 and Section 899 of the Internal Revenue Code, included as provisions in the budget bill under review by Congress. While significant modifications are anticipated, the latter two avenues have the potential to amplify “trade wars” into “capital and investment wars,” with the proposed introduction of adverse and broad-based taxation of foreign capital in the United States. In fact, the strategic economic policy of the US administration sees US trade deficits and the global role of US capital markets as manifestations of the same “public good” offered by the United States to the rest of the world via its reserve currency status. Import tariffs and taxation of foreign-owned US assets (including US Treasuries) are seen as potential levers to increase fiscal revenues, cheapen the US dollar, and allow the US to earn a fee for the service provided to the global economy via its liquid capital markets. Developments surrounding these policies could be very destabilizing for financial markets across currency, equity and fixed income, undermining the attractiveness of US assets at a time of large and growing financing needs (fiscal and trade deficits).
Over the past month, risky assets have generally overlooked these developments, with equities outperforming fixed income and credit spreads tightening by 20 - 60 bps between investment grade, high yield, emerging sovereign debt and bank loans. As a result, our barometer of global risk appetite has recently stabilized but remains on a decelerating trend, historically consistent with deteriorating growth expectations. On the other hand, US leading economic indicators continue to slow, led by weak business and consumer sentiment surveys, while hard economic statistics suggest ongoing resilience in labor markets and consumer spending. Our framework remains in a contraction regime for the 12th consecutive month, with growth below trend and decelerating (Figures 1 and 2).

Sources: Bloomberg L.P., Macrobond. Invesco Solutions research and calculations. Proprietary leading economic indicators of Invesco Solutions. Macro regime data as of May 31, 2025. The Leading Economic Indicators (LEIs) are proprietary, forward-looking measures of the level of economic growth. The Global Risk Appetite Cycle Indicator (GRACI) is a proprietary measure of the markets’ risk sentiment. Developed markets ex-USA include the eurozone, UK, Japan, Switzerland, Canada, Sweden, Australia. Emerging markets include Brazil, Mexico, Russia, South Africa, Taiwan, China, South Korea, India.

Source: Invesco Solutions, as of May 31, 2025.

Sources: Bloomberg L.P., Macrobond. Invesco Solutions research and calculations. Proprietary leading economic indicators of Invesco Solutions. Macro regime data as of May 31, 2025. The Leading Economic Indicators (LEIs) are proprietary, forward-looking measures of the level of economic growth. The Global Risk Appetite Cycle Indicator (GRACI) is a proprietary measure of the markets’ risk sentiment.

Sources: Bloomberg L.P., MSCI, FTSE, Barclays, JPMorgan, Invesco Solutions research and calculations, from Jan. 1, 1992 to May 31, 2025. The Global Leading Economic Indicator (LEI) is a proprietary, forward-looking measure of the growth level in the economy. A reading above (below) 100 on the Global LEI signals growth above (below) a long-term average. The Global Risk Appetite Cycle Indicator (GRACI) is a proprietary measure of the markets’ risk sentiment. A reading above (below) zero signals a positive (negative) compensation for risk-taking in global capital markets in the recent past. Past performance does not guarantee future results.
Contrary to the resilience in equity markets, downward revisions in earnings expectations have resumed across regions, with a sharp deterioration in cyclical markets such as Europe, Japan and most small open economies levered to global trade. As a result, our indicators point to weakening fundamentals in developed ex-US equities, leading us to a moderate underweight in this region relative to US equities for the first time since February (Figure 3).
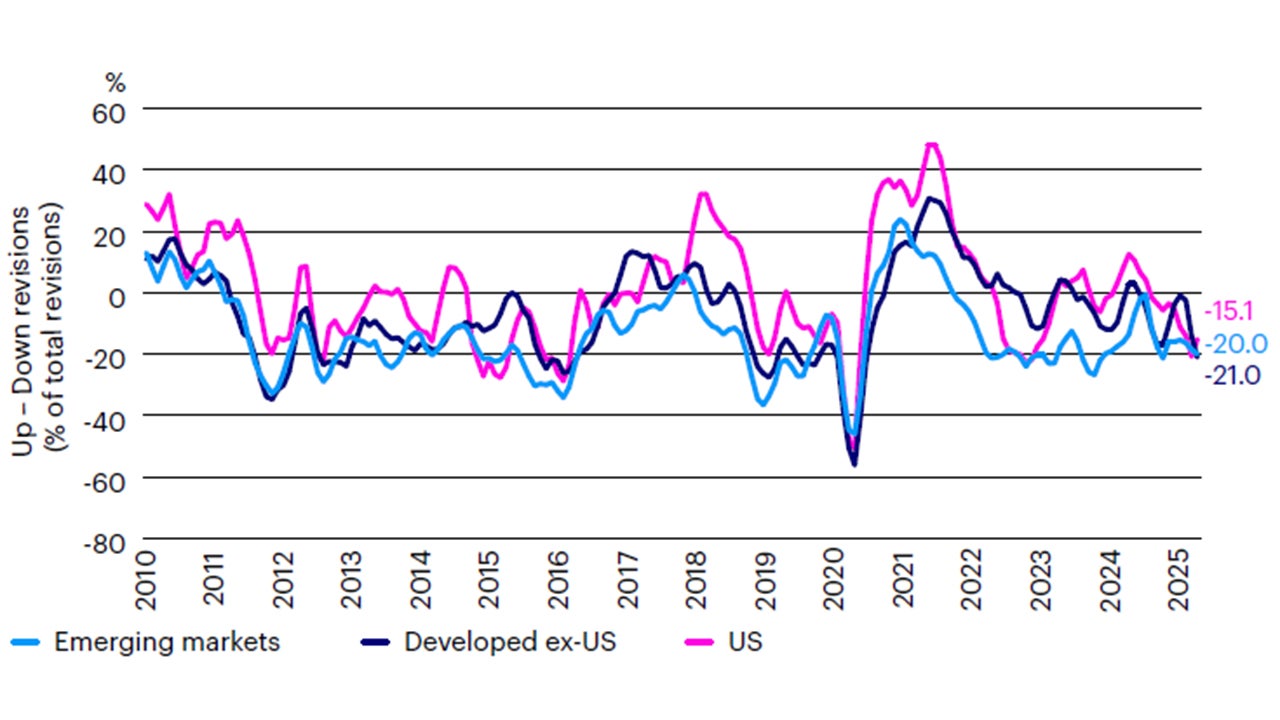
Sources: Bloomberg L.P., JPMorgan, Invesco Solutions research and calculations, from January 2010 to May 2025. 12-month forward earnings revisions computed as the number of upward revisions minus the number of downward revisions divided by total number of revisions. Past performance does not guarantee future results.
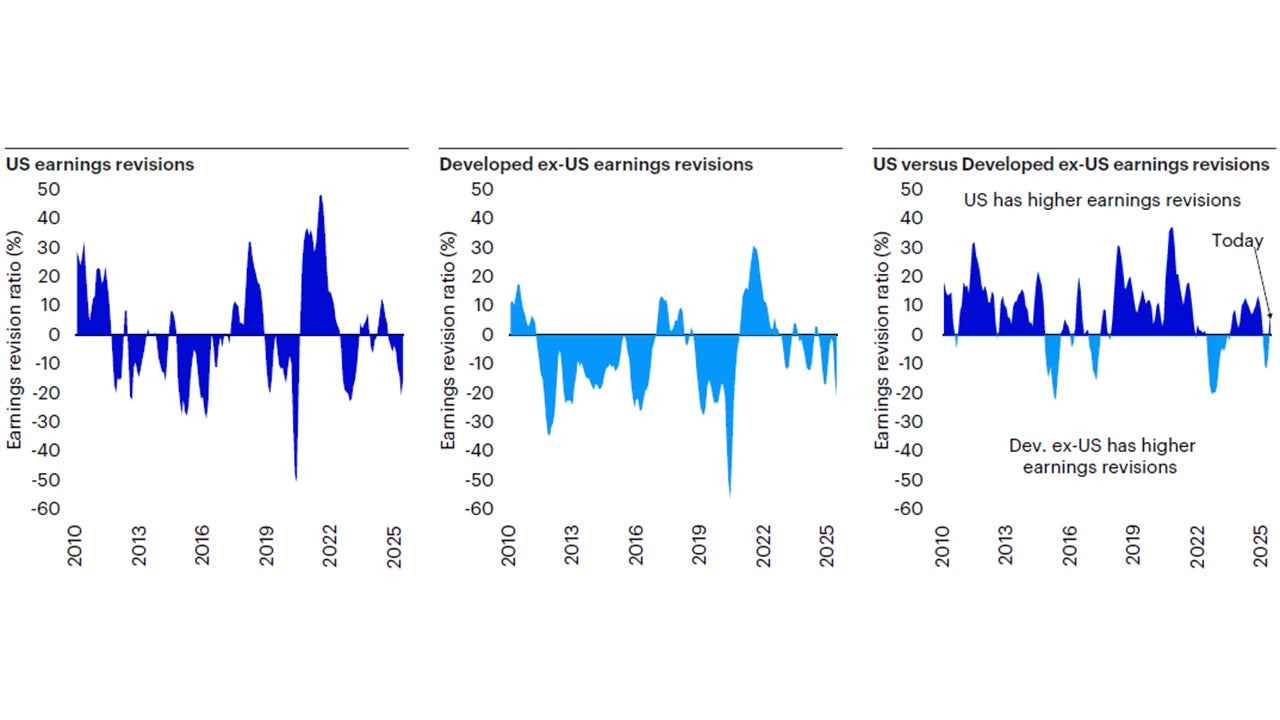
Sources: JPMorgan. Invesco Solutions calculations. As of May 31, 2025.
US equities represented by the MSCI USA Index. Developed ex-U.S. equities represented by the MSCI World ex-U.S. Index.
Earnings Revisions Ratio defined as 3-month average of (# Upward Revisions - # Downward Revisions) / (# Total Revisions), using 12-month forward earnings.
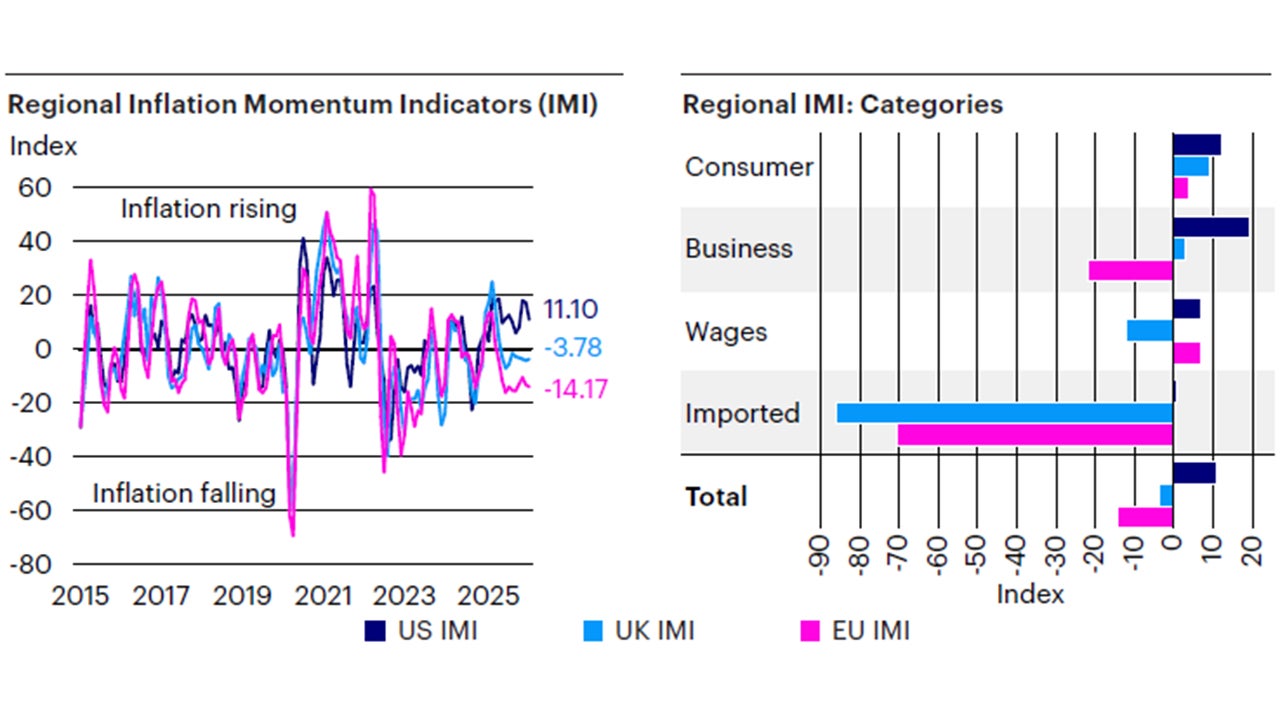
Sources: Bloomberg L.P. data as of May 31, 2025, Invesco Solutions calculations. The US Inflation Momentum Indicator (IMI) measures the change in inflation statistics on a trailing three-month basis, covering indicators across consumer and producer prices, inflation expectation surveys, import prices, wages, and energy prices. A positive (negative) reading indicates inflation has been rising (falling) on average over the past three months.
Investment positioning
We implemented minor changes to our asset allocation this month in the Global Tactical Allocation Model.1 We remain underweight risk relative to benchmark, underweighting equities relative to fixed income, primarily via an underweight to emerging markets and developed markets outside the US. We reinstate a moderate overweight to US equities versus other developed markets on deteriorating earnings expectations in Europe and Japan. We maintain overweight exposure to defensive sectors with quality and low volatility characteristics. In fixed income, we underweight credit risk2 relative to benchmark and overweight duration via inflation-linked bonds at the expense of nominal Treasuries (Figures 5 to 8). In particular:
- In equities, we return to a moderate overweight in the US relative to other developed markets. Despite renewed weakness in the US dollar, meaningful downward revisions in earnings expectations in Europe and Japan led our models to reduce exposure in these cyclical markets, more levered to global trade. Similarly, we maintain a moderate underweight in emerging market equities relative to developed markets. We continue to favor defensive sectors with quality and low volatility characteristics, tilting towards larger capitalizations at the expense of value, mid and small caps. We maintain exposures to defensive sectors such as health care, staples, utilities, and technology at the expense of cyclical sectors such as financials, industrials, materials, and energy.
- In fixed income, we underweight credit risk and overweight duration, favoring investment grade and sovereign emerging fixed income relative to high yield. Given the decelerating growth environment and historically tight credit spreads, we believe the risk-reward in this position is attractive. In sovereigns, we maintain a maximum overweight exposure to US TIPS relative to nominal Treasuries the given sticky inflation momentum in the US (Figure 4).
- In currency markets, we move to a moderate underweight in the US dollar, driven by narrowing interest rate differentials relative to the rest of the world and economic data outside the US continuing to surprise to the upside. Within developed markets, we favor the euro, the British pound, Norwegian kroner, Swedish krona, and Singapore dollar relative to the Swiss Franc, Japanese yen, Australian, and Canadian dollars. In EM, we favor high yielders with attractive valuations such as the Colombian peso, Brazilian real, Indian Rupee, Indonesian Rupiah, and Mexican peso, relative to low yielding and more expensive currencies such as the Korean won, Taiwan dollar, Philippines peso, and Chinese renminbi.
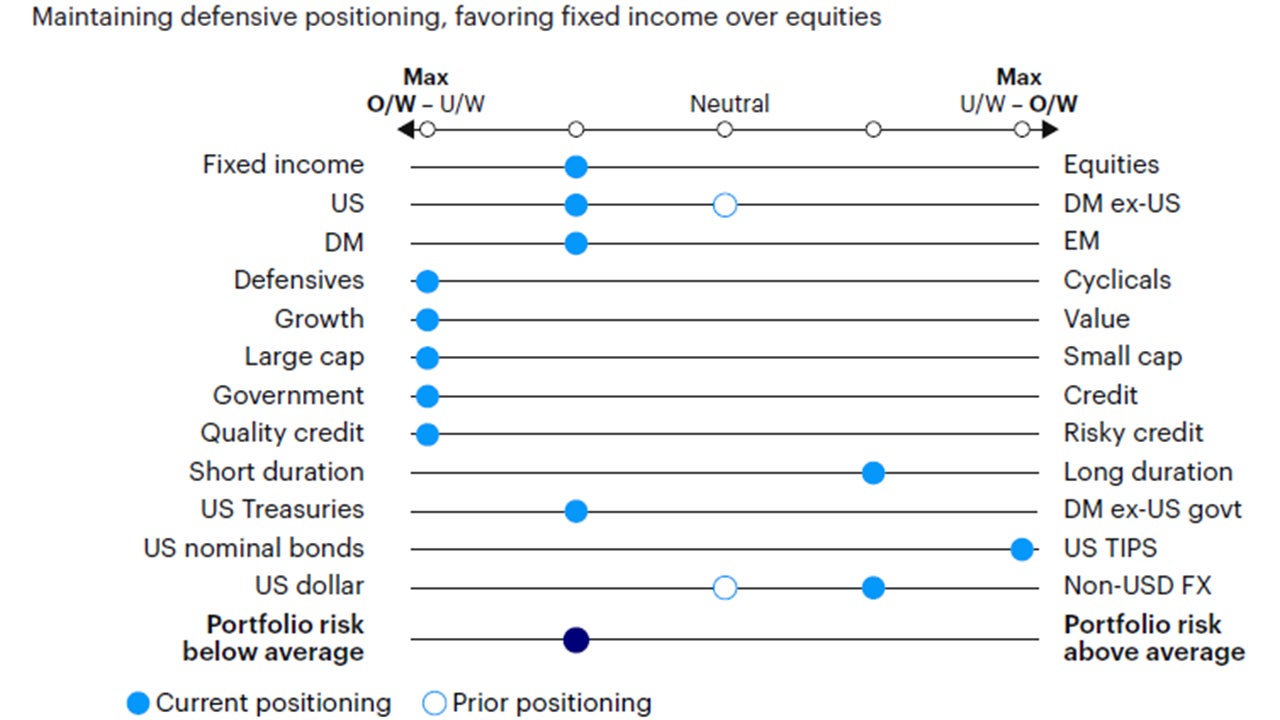
Source: Invesco Solutions, June 1, 2025. DM = developed markets. EM = emerging markets. Non-USD FX refers to foreign exchange exposure as represented by the currency composition of the MSCI ACWI Index. For illustrative purposes only.

Source: Invesco Solutions, June 1, 2025. For illustrative purposes only. Neutral refers to an equally weighted factor portfolio.
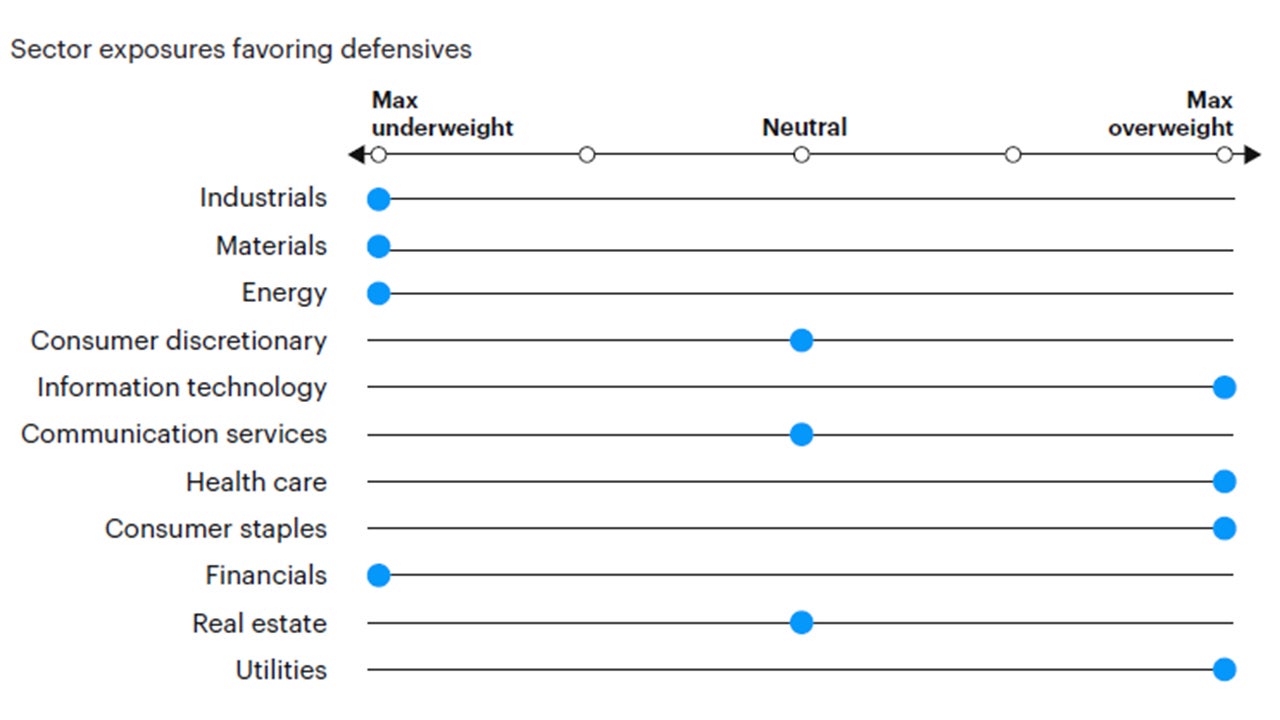
Source: Invesco Solutions, June 1, 2025. For illustrative purposes only. Sector allocations derived from factor and style allocations based on proprietary sector classification methodology. As of December 2023, Cyclicals: energy, financials, industrials, materials; Defensives: consumer staples, health care, information technology, real estate, utilities; Neutral: consumer discretionary and communication services.
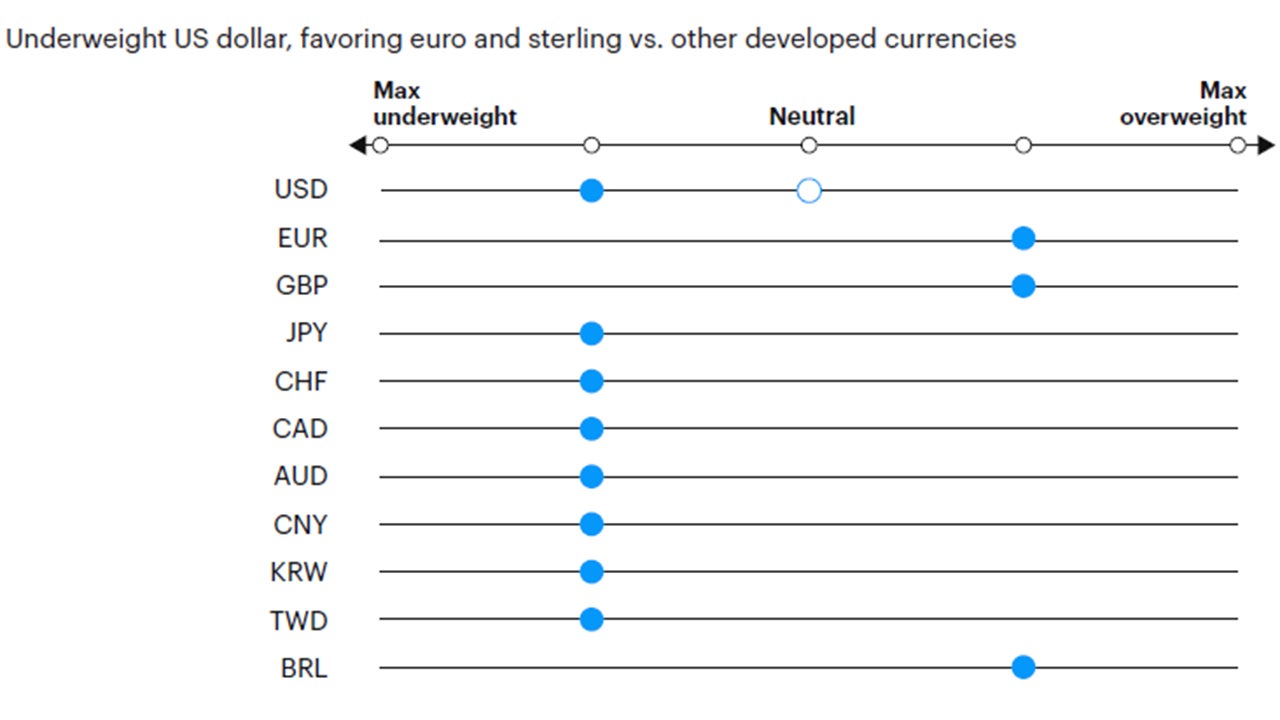
Source: Invesco Solutions, June 1, 2025. For illustrative purposes only. Currency allocation process considers four drivers of foreign exchange markets: 1) US monetary policy relative to the rest of the world, 2) global growth relative to consensus expectations, 3) currency yields (i.e., carry), 4) currency long-term valuations.
Investment risks
The value of investments and any income will fluctuate (this may partly be the result of exchange rate fluctuations), and investors may not get back the full amount invested.


