Tactical Asset Allocation - October 2025

Synopsis
Our framework remains in a contraction regime. We maintain a defensive posture, overweighting fixed income relative to equities, favoring defensive sectors and factors, while holding a neutral regional equity exposure in-line with the benchmark. In fixed income, we maintain a moderate overweight in duration, underweight in credit risk and the US dollar.
GDP and employment growth confirm the economy has entered a contraction regime, with growth below trend and decelerating. Earnings performance in cyclical and defensive sectors confirms this slowing growth environment.
We remain in a contraction regime, with defensive portfolio positioning. Our model is overweight fixed income versus equities, overweight quality and duration, and underweight the US dollar. We provide a deep dive into our indicators and assess their behavior considering current market and macro conditions.
Our macro process drives tactical asset allocation decisions over a time horizon between six months and three years, on average, seeking to harvest relative value and return opportunities between asset classes (e.g., equity, credit, government bonds, and alternatives), regions, factors, and risk premia..
Macro update
The macro environment remains in transition. Our indicators point to rising uncertainty regarding the perspective economic environment as our global leading economic indicator is gradually rising towards its long-term trend and global risk appetite, while still on a weakening trajectory, remains in positive territory without gaining momentum in either direction. Except for falling bond yields, global financial markets seem reluctant to price-in the low growth environment we have identified since July 2024, with equity markets still fueled by enthusiasm surrounding the tech super-cycle. This month, we provide answers to frequently asked questions from our clients, shedding light into our interpretation of the current market environment in the context of our macro models, seeking to interpret what is working, what is not working, and why.

Sources: Bloomberg L.P., Macrobond. Invesco Solutions research and calculations. Proprietary leading economic indicators of Invesco Solutions. Macro regime data as of Sept. 30, 2025. The Leading Economic Indicators (LEIs) are proprietary, forward-looking measures of the level of economic growth. The Global Risk Appetite Cycle Indicator (GRACI) is a proprietary measure of the markets’ risk sentiment. Developed markets ex-USA include the Eurozone, UK, Japan, Switzerland, Canada, Sweden, Australia. Emerging markets include Brazil, Mexico, Russia, South Africa, Taiwan, China, South Korea, India.

Source: Invesco Solutions as of Sept. 30, 2025.

Sources: Bloomberg L.P., Macrobond. Invesco Solutions research and calculations. Proprietary leading economic indicators of Invesco Solutions. Macro regime data as of Sept. 30, 2025. The Leading Economic Indicators (LEIs) are proprietary, forward-looking measures of the level of economic growth. The Global Risk Appetite Cycle Indicator (GRACI) is a proprietary measure of the markets’ risk sentiment.
Why has global risk appetite declined over the past 16 months while equity markets are making all-time highs?
Our global risk appetite cycle indicator (GRACI) measures the average additional return received by investors when taking incremental risks (i.e., volatility) in global capital markets, going from developed market government bonds, to emerging markets sovereign credit, corporate credit, developed market equities and emerging market equities. As illustrated in Figure 2, GRACI’s value is still positive, at approximately 0.50, meaning that over the past year investors have been compensated on average for risk taking and moving from safer to riskier asset classes. In other words, GRACI’s positive value today, and the positive value registered since 2021, is not at odds with equity markets at all-time highs. However, the steady decline in GRACI over the past 16 months, from a peak level above 1.5, is capturing the convergence in returns between safer and riskier asset classes. As illustrated in previous research,1 this convergence in returns, and hence deceleration in global risk appetite, has historically provided a good proxy of declining growth expectations, as GRACI exhibits a strong correlation to future growth (higher than 0.70) with a lead of 3-6 months over other leading indicators. An alternative and simpler illustration of this convergence in returns is illustrated in Figure 3. Year to date, equities continue to outperform fixed income, and credit markets continue to outperform government bonds, but the pace of outperformance has declined meaningfully compared to calendar year 2023 and 2024. While GRACI’s level today remains positive, GRACI deceleration over the past 16 months is capturing this reduced outperformance, which has historically been a precursor for further declines in global risk appetite.

Sources: Bloomberg L.P., MSCI, FTSE, Barclays, JPMorgan, Invesco Solutions research and calculations, from Jan. 1, 1992 to Sept 30, 2025. The Global Leading Economic Indicator (LEI) is a proprietary, forward-looking measure of the growth level in the economy. A reading above (below) 100 on the Global LEI signals growth above (below) a long-term average. The Global Risk Appetite Cycle Indicator (GRACI) is a proprietary measure of the markets’ risk sentiment. A reading above (below) zero signals a positive (negative) compensation for risk-taking in global capital markets in the recent past. Past performance does not guarantee future results.
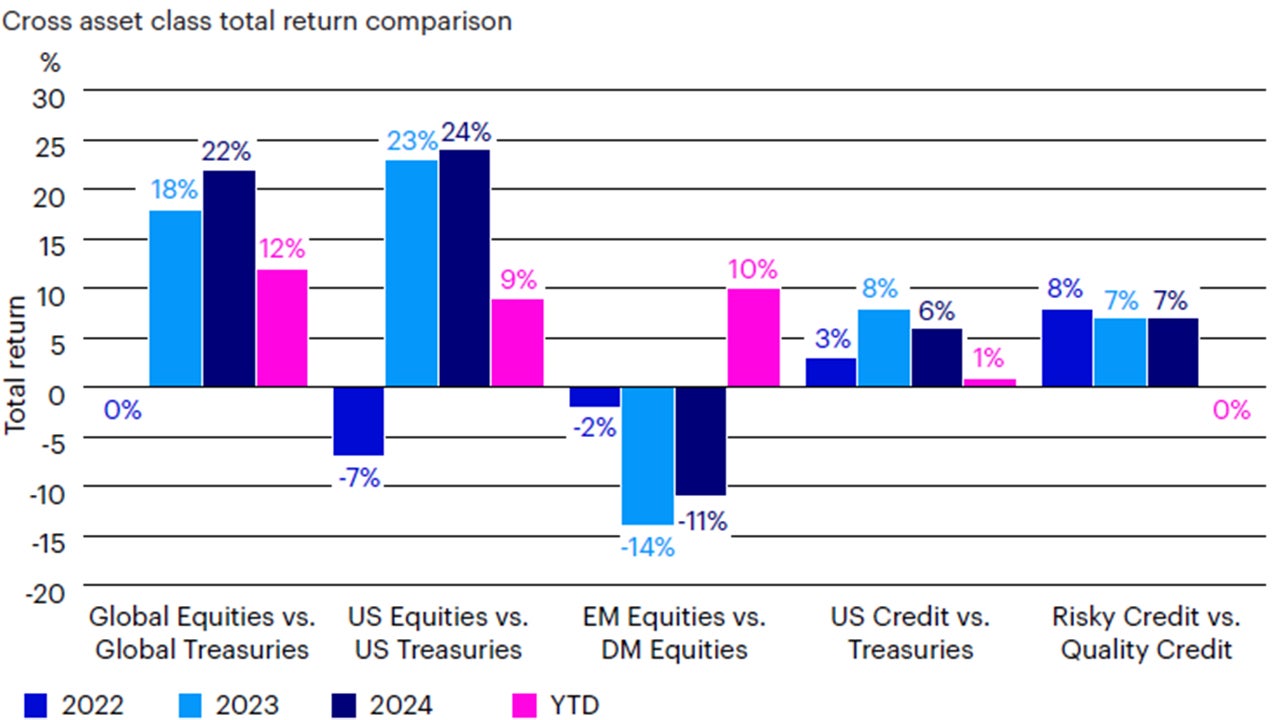
Source: Bloomberg L.P., Invesco Solutions research and calculations. Data as of September 30, 2025. Global equities = MSCI All Country World index; Global Treasuries = Bloomberg Global Agg Treasuries Index; US equities = Russell 3000 Index; US Treasuries = Bloomberg US Treasury Index; EM equities = MSCI Emerging Markets Index; DM equities = MSCI World Index; US Credit = average of Bloomberg US Corporate HY Index, Bloomberg US Corporate IG Index, S&P US leveraged loan index; Risky Credit = average of Bloomberg US Corporate HY Index and S&P US leveraged loan index; Quality Credit = average of Bloomberg US Corporate IG Index and Bloomberg US Treasury Index.
Our macro framework moved to a Contraction regime (i.e., growth below trend and decelerating) in July 2024. What is the evidence that the economy moved to a below-trend and decelerating growth environment?
Historically, our macro indicators tend to lead inflection points in the growth cycle by approximately 6 months, on average, looking at contemporaneous or lagging indicators such as GDP, industrial production or employment growth. Hence, by historical standards, our framework would have anticipated a below-trend and decelerating growth regime by the first half of 2025, which we believe is indeed the prevailing environment today. As illustrated in Figure 4, US real GDP growth has moved below trend since Q4 2024, and US employment growth is currently averaging 60k over the past 6 months and 30k over the past 3 months, well below the long-term trend growth of 150-200k.
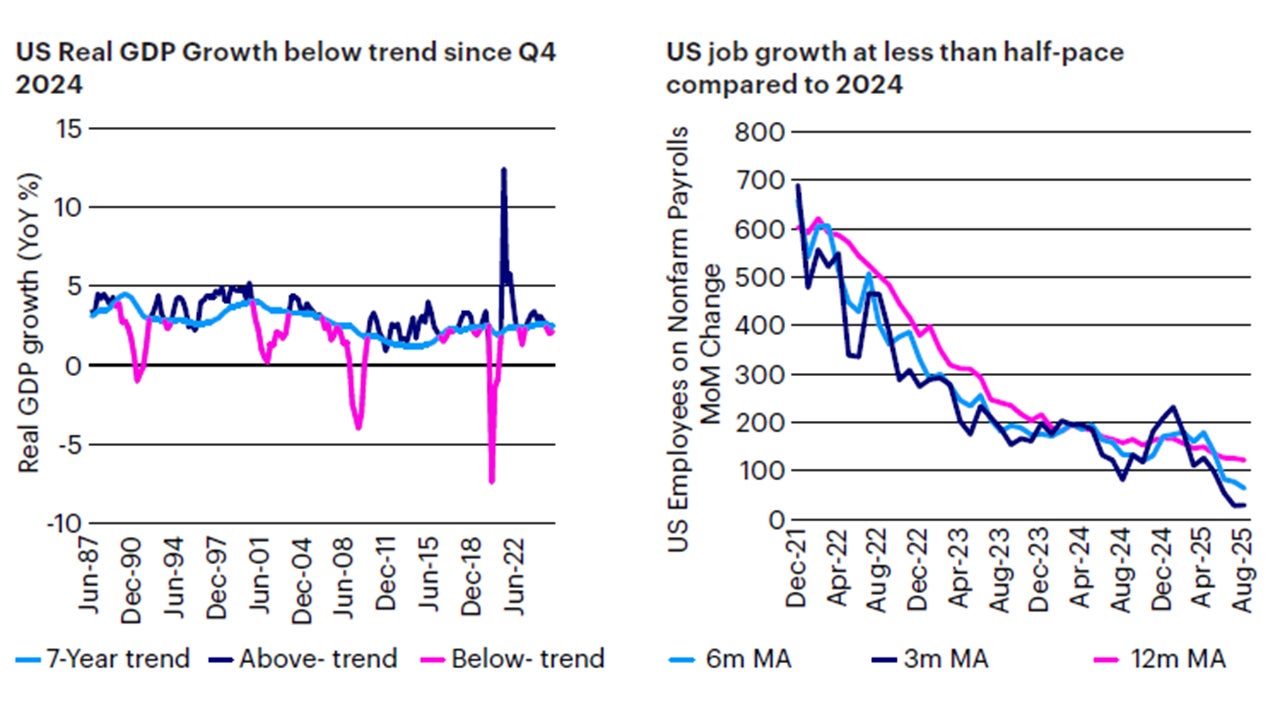
Source: Bloomberg L.P., Invesco Solutions research and calculations. Data as of September 30, 2025.
What about the disconnect between financial markets and the economy?
Our business cycle framework seems to be accurately capturing the early stages of a low growth environment, and rising probabilities of a recession, but global financial markets are sending mixed signals. While the noticeable decline in US and global bond yields year-to-date is consistent with this contraction regime, global equity markets are experiencing a meaningful divergence from this cyclical picture, driven by a structural technology-led super-cycle. As illustrated in Figure 5, cyclical sectors in the S&P 500 have experienced very low growth rates of 1-3% in earnings, revenues and margins, underperforming defensive sectors and confirming weakness in cyclical drivers. On the other hand, the structural super-cycle in technology, unrelated to the economic growth cycle, is translating into 20%+ annual growth in earnings and revenues for the sector, leading to large excess cash and aggressive stock buybacks programs, lifting the composite S&P 500 Index. We believe it is important to adhere to a structured and repeatable investment process and, most importantly, risk budgeting by diversifying active investment views across many asset classes and portfolio levers. From an asset allocation standpoint, while equities and credit markets are certainly proving more resilient than anticipated, the relative underperformance of small- and mid-caps relative to large caps, value relative to quality, and cyclical relative to defensive sectors is consistent with the growth headwinds outlined above.
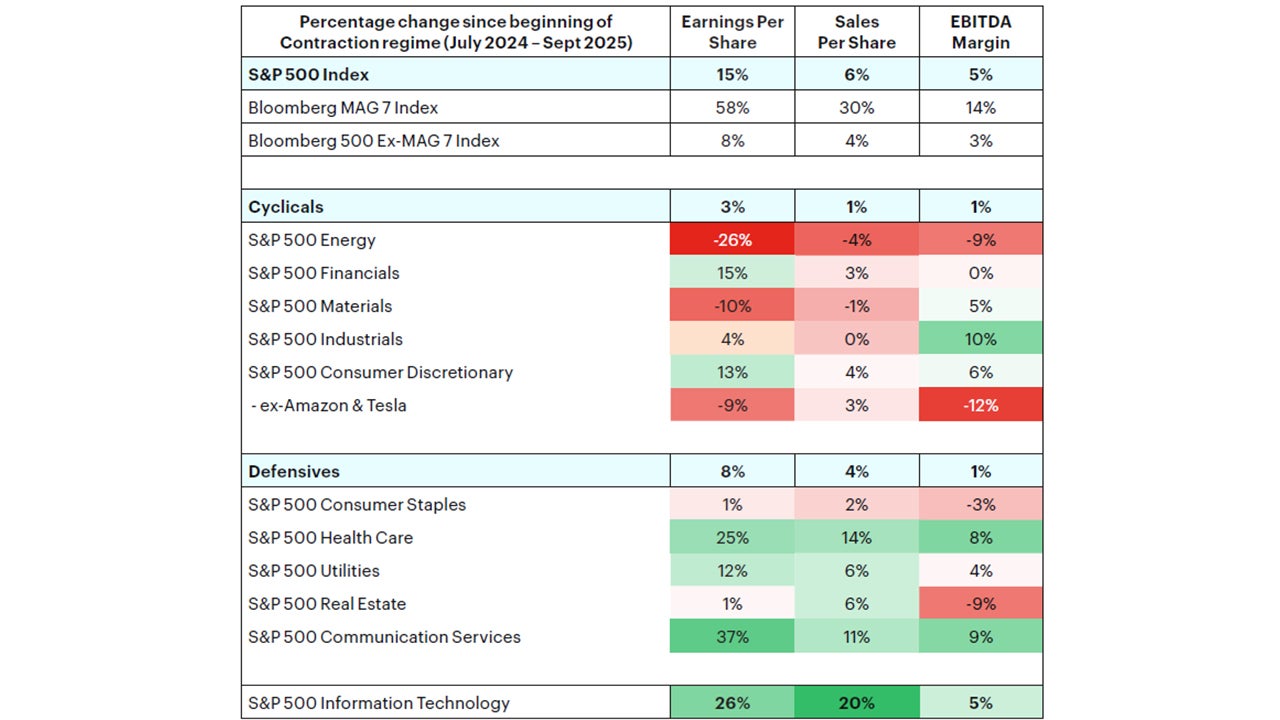
Source: Bloomberg L.P., S&P500. Trailing 12-month EPS and Sales per share.
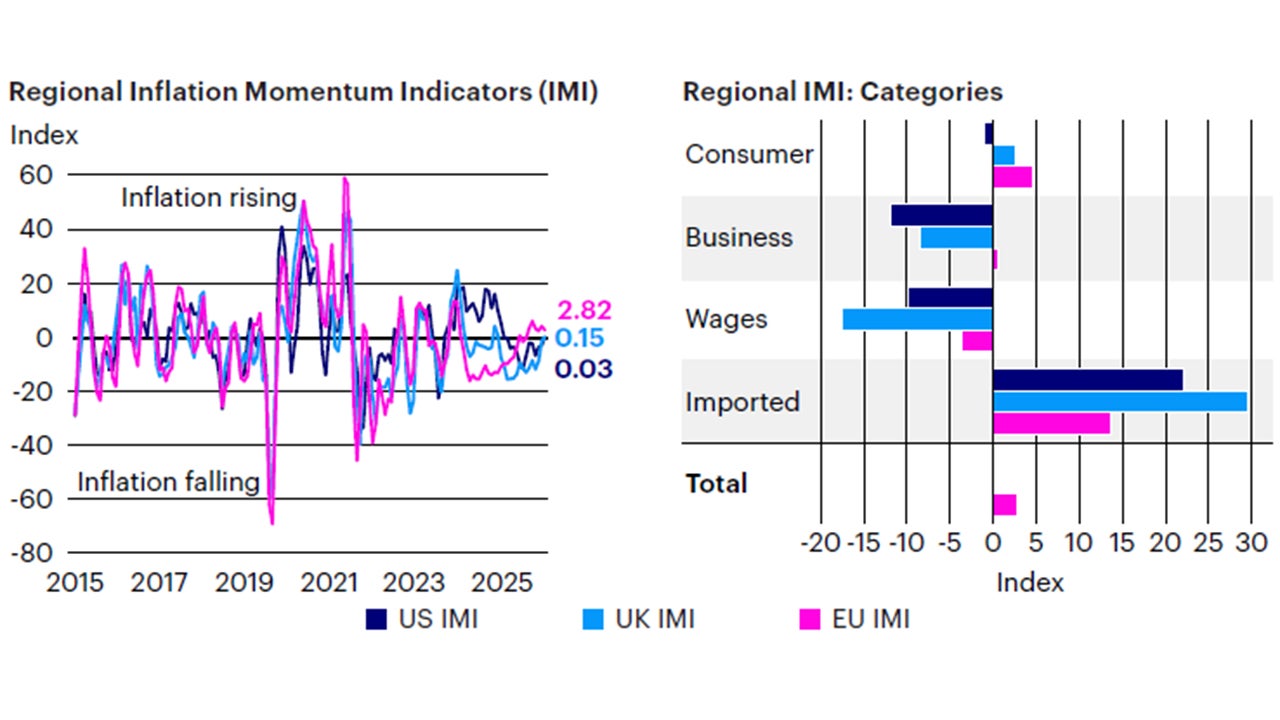
Sources: Bloomberg L.P. data as of Sept. 30, 2025, Invesco Solutions calculations. The US Inflation Momentum Indicator (IMI) measures the change in inflation statistics on a trailing three-month basis, covering indicators across consumer and producer prices, inflation expectation surveys, import prices, wages, and energy prices. A positive (negative) reading indicates inflation has been rising (falling) on average over the past three months.
Investment positioning
We implemented no changes this month to the Global Tactical Allocation Model.2 We continue to hold a lower risk profile than the benchmark, underweighting equities relative fixed income, with a regional equity composition in line with the benchmark following last month upgrade in non-US equities. We continue to overweight defensive sectors with quality and low volatility characteristics. In fixed income, we underweight credit risk3 relative to benchmark and overweight duration via nominal Treasuries (Figures 7 to 10). In particular:
- In equities, we maintain a neutral regional composition versus benchmark given offsetting forces between US earnings outperformance versus the rest of the world, and US dollar depreciation driven by expectations for Fed easing and compression in yield differentials between the US and the rest of the world. We favor defensive sectors with quality and low volatility characteristics, tilting towards larger capitalizations at the expense of value, mid and small caps, as these segments of equity markets carry lower operating leverage and lower sensitivity to growth risk. Hence, we favor sectors such as health care, staples, utilities, and technology at the expense of cyclical sectors such as financials, industrials, materials, and energy.
- In fixed income, we continue to overweight asset classes with lower credit risk and higher duration, favoring investment grade and sovereign emerging fixed income relative to high yield. Given the decelerating growth environment and historically tight spreads, we believe the risk-reward in this position is attractive. Our bearish positioning on the US dollar also favors emerging markets local debt and global fixed income, currency unhedged, relative to core domestic fixed income. We favor nominal Treasuries versus TIPS given limited inflationary pressures (Figure 6).
- In currency markets, we continue to underweight the US dollar, driven by narrowing yield differentials relative to the rest of the world and positive surprises in economic data outside the US. Furthermore, we believe this positioning is also supported by rising debt funding requirements in the US, putting downward pressure on the greenback to attract foreign capital flows. Within developed markets we favor the euro, the British pound, Norwegian kroner, Australian dollar and the Japanese yen relative to the Swiss franc, Canadian dollar, Swedish krona and Singapore dollar. In EM we favor high yielders with attractive valuations as the Colombian peso, Brazilian real, Indian rupee, and Indonesian rupiah relative to low yielding and more expensive currencies as the Korean won, Philippines peso, Thai baht and Chinese renminbi.
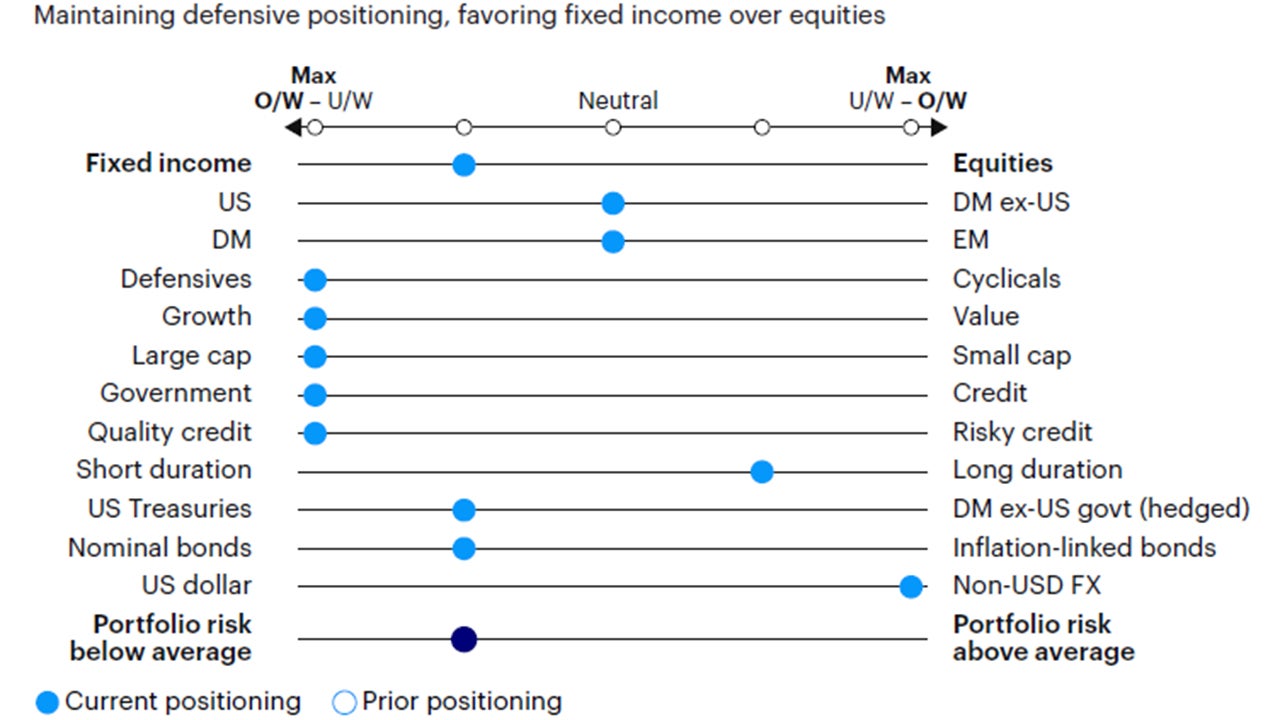
Source: Invesco Solutions, Oct. 1, 2025. DM = developed markets. EM = emerging markets. Non-USD FX refers to foreign exchange exposure as represented by the currency composition of the MSCI ACWI Index. For illustrative purposes only.

Source: Invesco Solutions, Oct. 1, 2025. For illustrative purposes only. Neutral refers to an equally weighted factor portfolio.
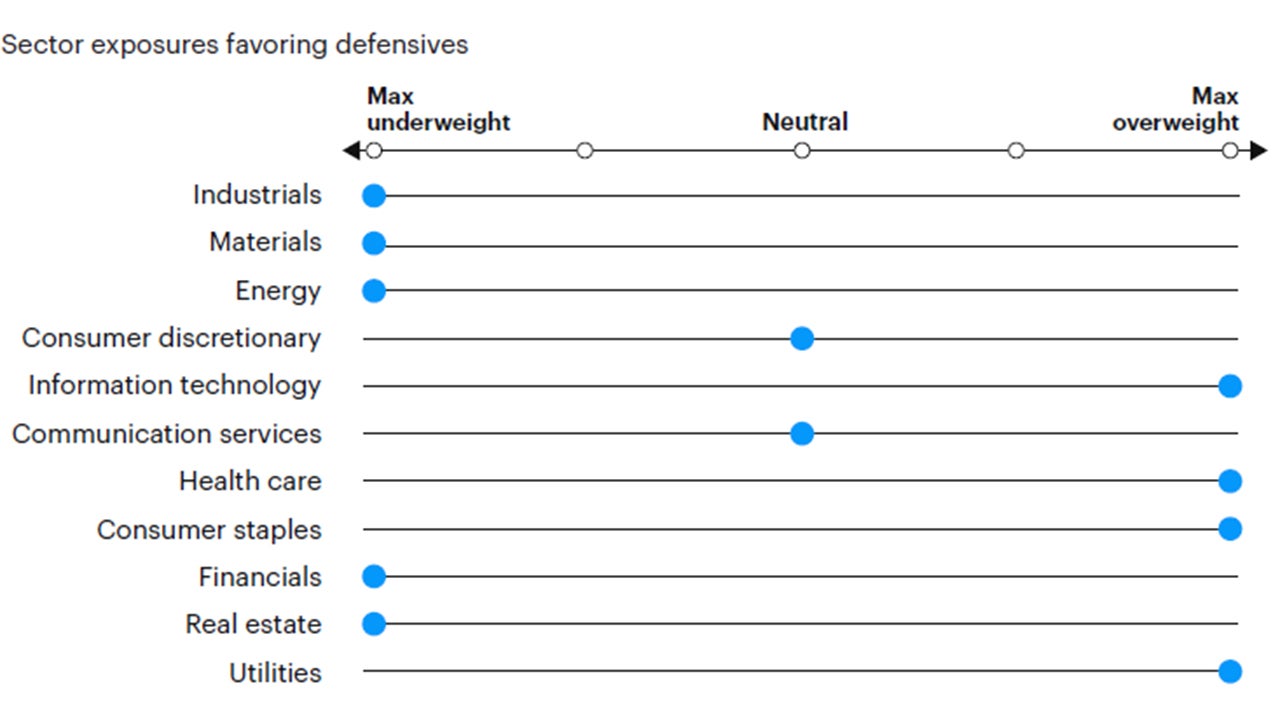
Source: Invesco Solutions, Oct. 1, 2025. For illustrative purposes only. Sector allocations derived from factor and style allocations based on proprietary sector classification methodology. As of December 2023, Cyclicals: energy, financials, industrials, materials; Defensives: consumer staples, health care, information technology, real estate, utilities; Neutral: consumer discretionary and communication services.
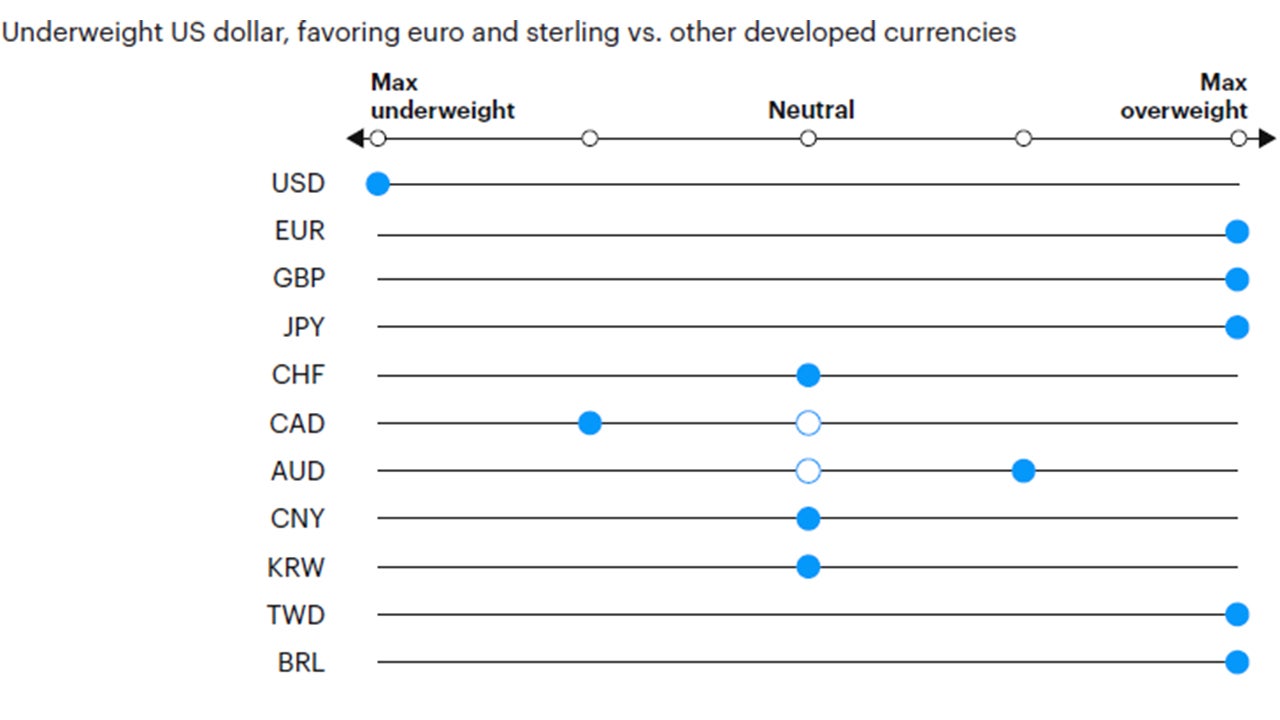
Source: Invesco Solutions, Oct. 1, 2025. For illustrative purposes only. Currency allocation process considers four drivers of foreign exchange markets: 1) US monetary policy relative to the rest of the world, 2) global growth relative to consensus expectations, 3) currency yields (i.e., carry), 4) currency long-term valuations.
Investment risks
The value of investments and any income will fluctuate (this may partly be the result of exchange rate fluctuations), and investors may not get back the full amount invested.


