Chaos can create opportunities

Bottoming is a process, but we see signs that risk-off positioning is getting extreme.
Heading into 2020, the global economy was showing signs of stabilizing and risk assets were benefiting from the cyclical rebound in activity.
In recent months, however, the coronavirus has delivered a significant external shock to Chinese and global economic activity at a vulnerable stage of the business cycle.
Meanwhile, markets are reacting to the contagion and associated loss of output with a dramatic repricing of risk across a wide array of assets.
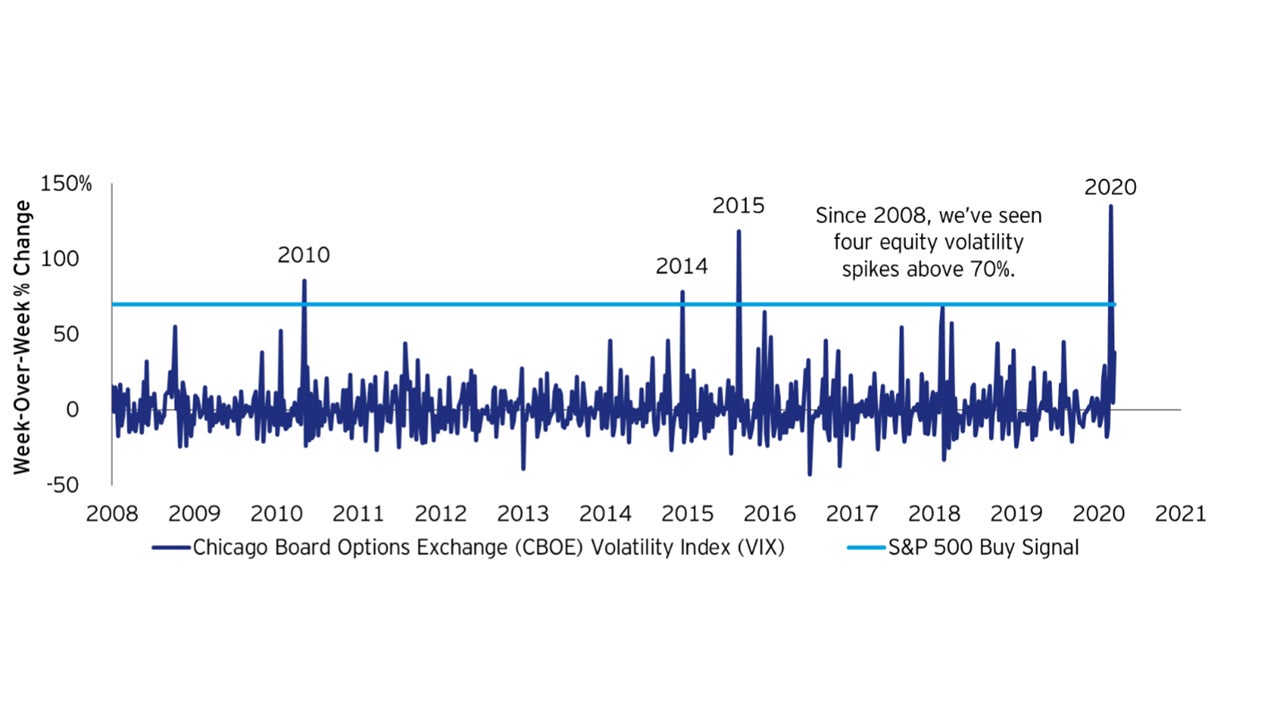
The S&P 500 Index has fallen almost 30% from its all-time high in February,1 culminating in the highest percentage increase in equity volatility of the cycle and in the history of the Chicago Board of Options Exchange (CBOE) Volatility Index (VIX).
The highest percentage increase in equity volatility of all time!
US equity volatility and week-over-week percentage increases above 70% since 2008

Both the price of West Texas Intermediate (WTI) crude oil and the S&P 500 Energy sector have skidded over 60% from their year-to-date highs in January2 (another significant exogenous shock to the economy at a weak point in the cycle), raising grave concerns about the fundamental health of energy producers.
High-yield corporate bond spreads above their government counterparts have widened to levels not seen since 2015 to 2016, the last major dislocation in oil prices and energy stocks.
Are we trading ourselves into an economic recession? Is this becoming a self-fulfilling prophecy?
For economists, those are serious questions worth considering. If the 2015-2016 experience is any guide, we could at least be facing an energy-led contraction in business spending and corporate profits.
Are there any mitigating forces, short of a cure or vaccine for the virus, that could help soften the blow?
First, what I think is bad for US energy producers — a much smaller share of gross domestic product (GDP) — is good for US energy consumers — a much larger share of GDP. For example, lower oil prices lead to lower retail gasoline prices, eventually freeing up money in consumer pocketbooks for spending, saving, or paying down debt.
Second, the 10-year Treasury bond yield — which has bounced off its nearby low — remains well below its high for the year.3 The associated decline in mortgage interest rates has sparked a surge in refinancing activity, which should ultimately liberate additional household cashflow.
Third, monetary and fiscal authorities around the planet have responded rapidly to the associated tightening of financial conditions, doing their part to help avoid a potential credit crunch by cutting interest rates, expanding asset purchases, injecting liquidity, and appropriating funds to fight the outbreak. Indeed, Congress has agreed on another round of substantial fiscal stimulus.
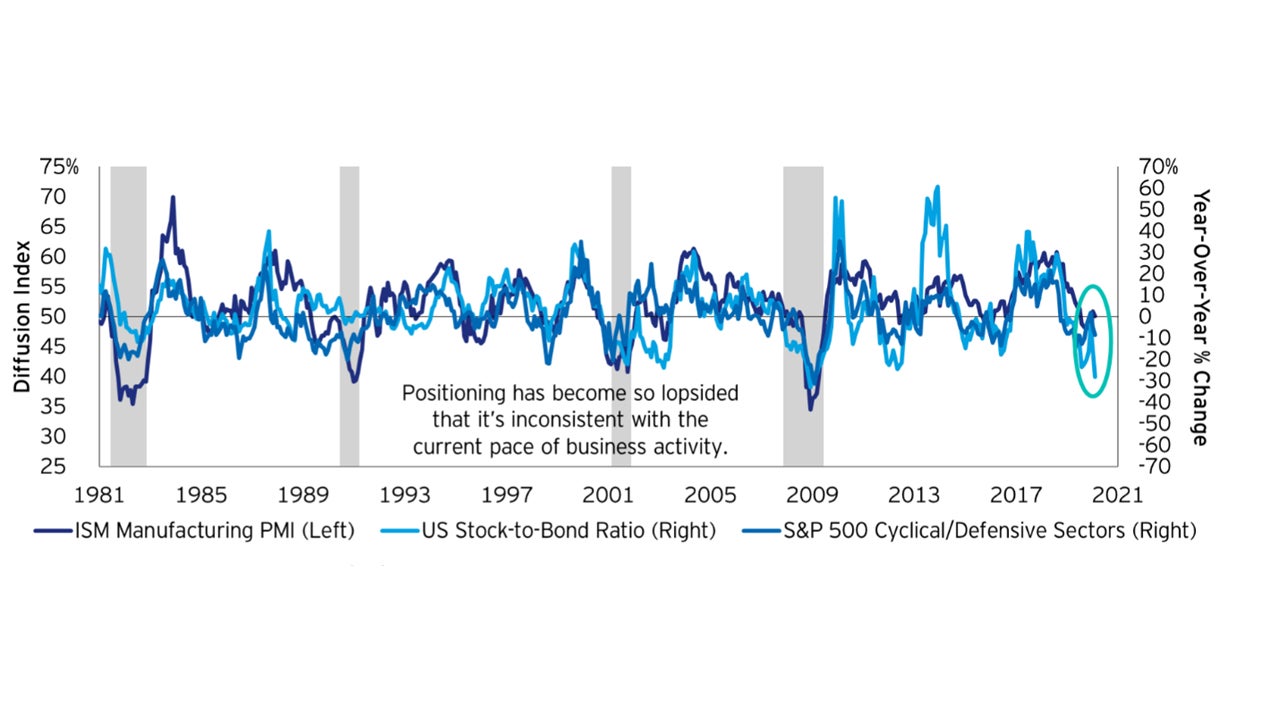
For market strategists, the answer to whether we’re facing a recession is academic. Certain market segments such as bonds and defensive equity sectors are behaving like the economy is already contracting.
Under the circumstances, investor risk-off positioning is understandable. However, in my view, it has become so lopsided that it’s inconsistent with the current pace of business activity in the US.
From a contrarian perspective, equities and cyclical sectors of the market are so out of favor that they’re becoming interesting again. Contrastingly, bonds and defensive equity sectors seem stretched.
Investor risk-off positioning appears extreme
Manufacturing activity (left-axis), US equity relative to government bond returns and cyclical relative to defensive sector returns (right-axis) since 1981

What does heightened turbulence mean for future returns on stocks?
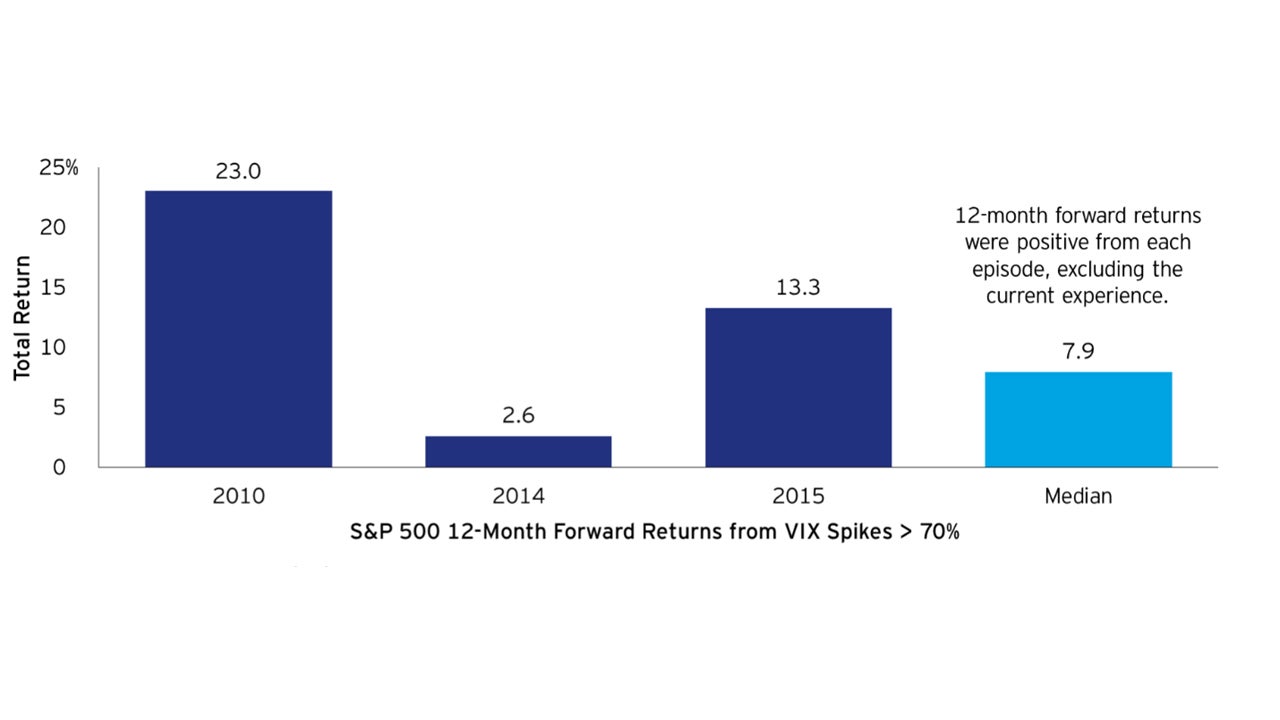
Since 2008, we’ve seen four equity volatility spikes above 70%. Encouragingly, 12-month forward returns were positive from each episode (excluding the current experience), with a median return of 8%.4
In other words, I believe near-term chaos can create long-term opportunities for patient investors.
Chaos can create opportunities
1 year ahead returns on US stocks from volatility increases above 70% since 2008

To be clear, bottoming is a process and virus-related uncertainty could continue to weigh on markets until the number of new cases outside of China peaks and/or the fiscal response becomes coordinated and forceful.
However, indications of excessive caution in the marketplace suggest savvy investors may start looking for opportunities to be contrarian when others are fearful.
1 Source: Bloomberg, L.P. as of March 18, 2020
2 Source: Bloomberg, L.P. as of March 18, 2020
3 Source: Bloomberg, L.P. as of March 18, 2020
4 Source: Bloomberg, L.P., Invesco as of March 13, 2020


