Economy 2021: Global Economic Outlook
What kind of economic recovery can we expect to see in 2021?

Although the current US business expansion became the longest on record from July 2019 – exceeding the 120 months of the 1991-2001 upswing – it has also been the slowest, with real GDP growth averaging only 1.8% p.a. since 2009.
In recent months, despite the implementation of President Trump’s Tax Cuts and Jobs Act of December 2017, there has been concern that growth appears to be slowing again.
We define a slowdown as a ten-point drop in the US ISM Manufacturing Purchasing Manager Index from its rolling two-year maximum.
Since 1960, there have been 15 slowdowns in the US, of which only seven turned into a recession, as measured by the NBER (National Bureau of Economic Research).
Technically, as of July 2019 the US isn’t even in a slowdown, although clearly very close to being in one.
John GreenwoodAll recessions begin as slowdowns but not all slowdowns end in recession
Slowdowns are much more likely to morph into recessions when financial and economic imbalances are elevated. We can group these imbalances into three types:
Fast debt growth is often associated with excess leverage and bad lending decisions, which makes economies more vulnerable to adverse shocks.
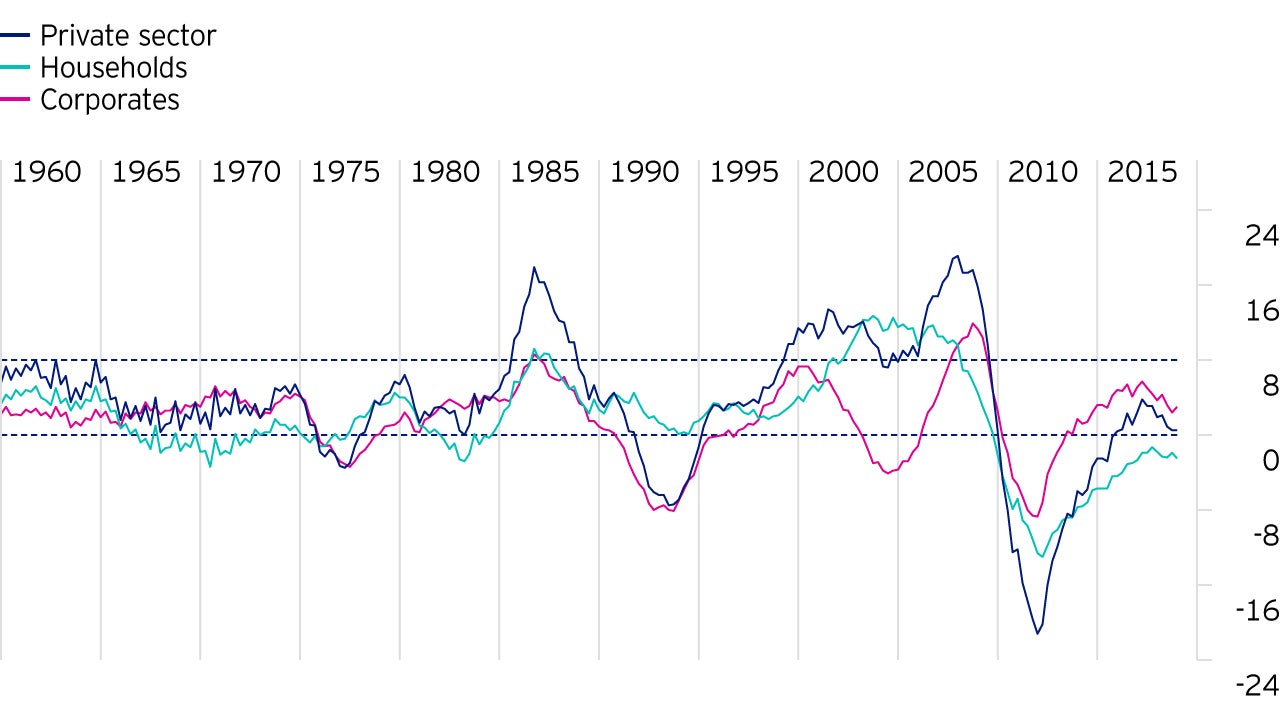
Private non-financial sector debt, which includes both household debt and corporate debt, has increased slightly as a percentage of GDP since 2015, but remains well below its 2009 peak of 170% of GDP.

While household debt has fallen over the past decade, corporate debt has risen to historically high levels. Despite this, the 12-quarter change in corporate debt as a percentage of GDP, is still well below 8% per annum, as indicated by the horizontal black dashed line in Figure 1. Growth of private non-financial sector debt above this level has been associated with recessions in the past.
As a percentage of GDP, cyclical spending (personal consumption expenditures of durable goods, residential investment, non-residential fixed investment and business inventories) is far below its peak in 2006 but has been rising since 2009 when it stood at 19% of GDP, the lowest in more than half a century.
A direct result of this is the average age of the capital stock within the US private sector has been aging and has been doing so since 1990. Notably, the average age of US homes has risen by almost five years since 2006, and with housing starts and the vacancy rate at historically low levels, we can conclude there is no excess in cyclical spending. Furthermore, a value of cyclical spending of above 27% of potential GDP has typically been associated with periods of excess. Currently, cyclical spending amounts to around 25% of potential GDP, in line with its historic average.
Periods of elevated inflation are usually countered by restrictive monetary policy from the US Federal Reserve. This puts a squeeze on money and credit causing total spending to fall, and the economy falls into recession.
Recessions tend to result from either economic overheating, or financial market overheating. Rising inflation preceded the recession of 1970, the recession of 1973-74, and the back-to-back recessions of 1980-82.
Since the mid-1990s, core inflation in the US has never reached over 2.5% p.a. More recently, broad money supply (M2) growth has fallen from its highs of 9% p.a. in late 2016 to around 4-5% p.a., suggesting inflation should continue to decline. Across most of the advanced economies, inflation is not high enough to be a recessionary threat.
Since money and credit are not being squeezed, and household and financial sector balance sheets remain strong, there is little basis - from either monetary policy or sectoral balance sheet stresses - for predicting a US recession in the near or medium term. Even so, slowdowns occur often within the overall business cycle expansion. If characterised by a drop in the ISM Manufacturing PMI, they occur roughly every three to four years.
Not all slowdowns evolve into a recession. The odds that a slowdown does turn into a recession are roughly 50%. Recessions are usually caused by an economic or financial imbalance e.g. excess private sector debt growth, high levels of cyclical spending, or rising inflation.

What kind of economic recovery can we expect to see in 2021?

This white paper addresses our short-term investment views based on our forward-looking global macro framework.

After a short, sharp recession (and more rapid rebound than we expected), the question is whether we are now at the start of a new global cycle?

