Managing climate risk: a 21st century approach for commercial real estate investors

Key takeaways
Temperatures are rising
Investors cannot turn a blind eye
Data is king
Over the last 100 years, global temperature anomalies have risen in number.
What’s more, natural disasters are becoming more frequent and more severe.
In 2021 alone, the world witnessed severe flooding in Western Europe and China, ice storms in Texas and wildfires in California – all of which exacted enormous economic and human costs.
Reinsurance data highlights the increasing cost of such disasters. Global economic losses from natural and manmade catastrophes totalled $202 billion in 2020, up from $150 billion in 2019.
Though governments, not-for-profit organisations and the private sector have joined the fight against climate change, even the most drastic interventions will take years to reverse the global warming trend.
The cost of extreme weather is expected to continue climbing for the foreseeable future.
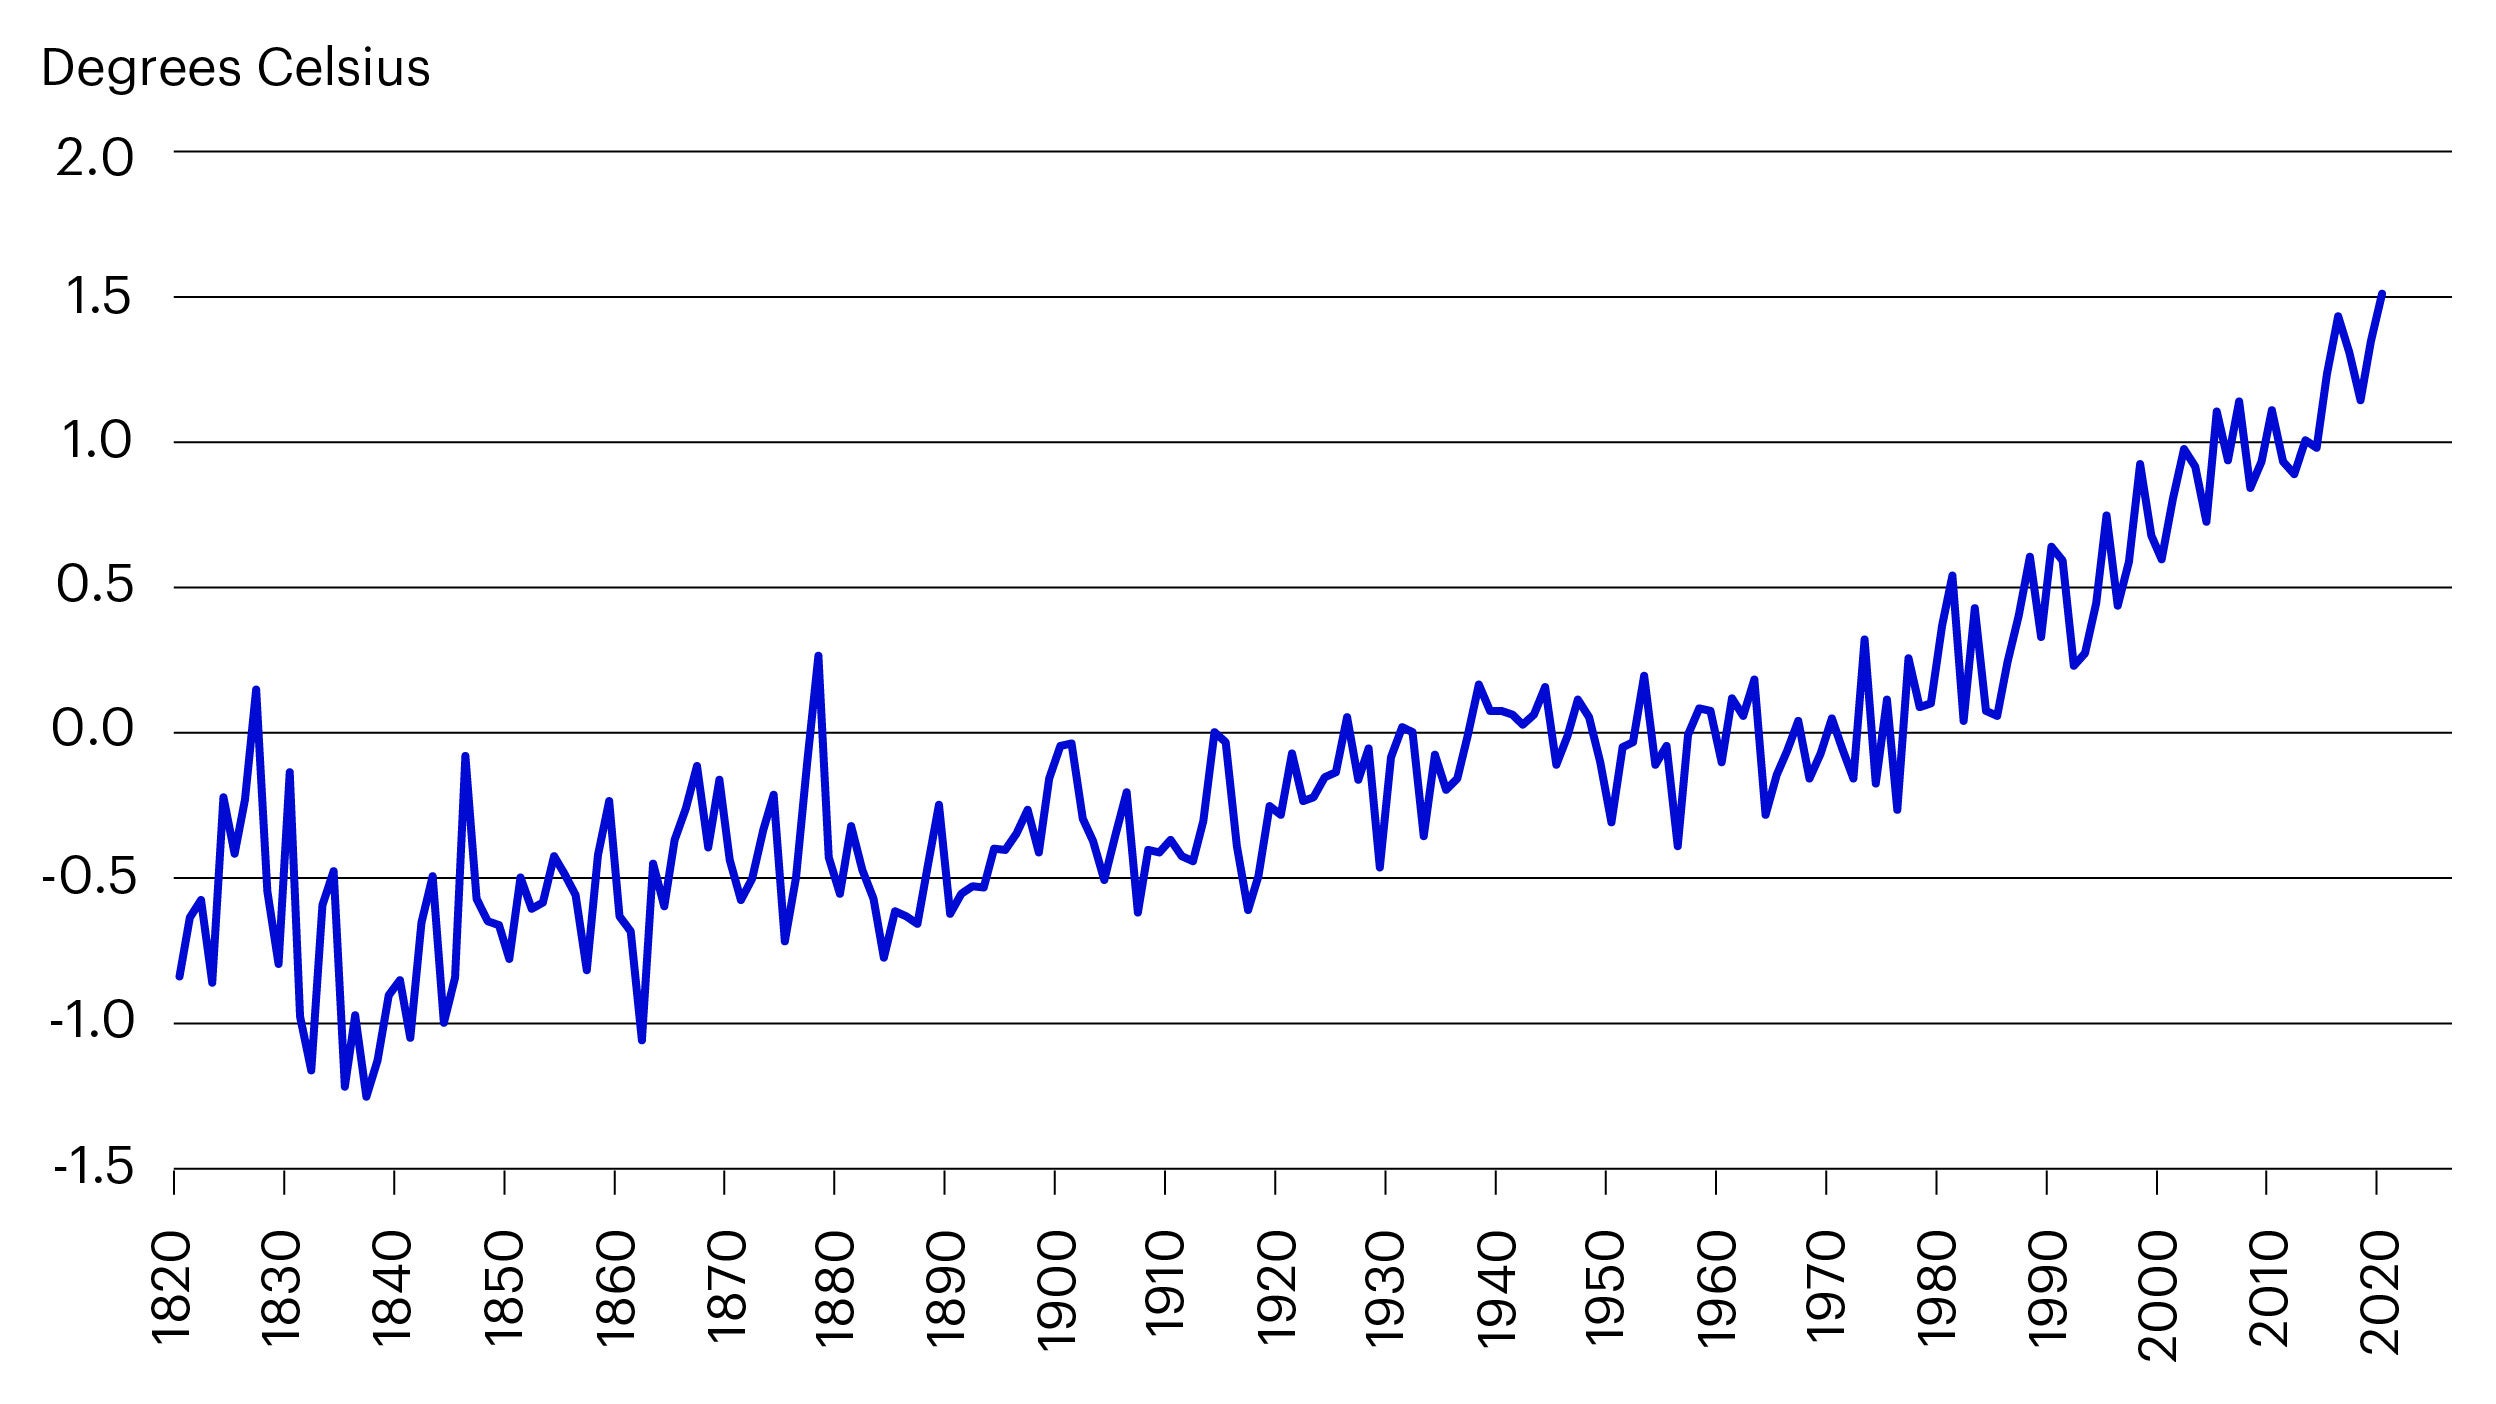
Source: Berkley Earth. Temperature anomalies relative to the January 1951-December 1980 average.
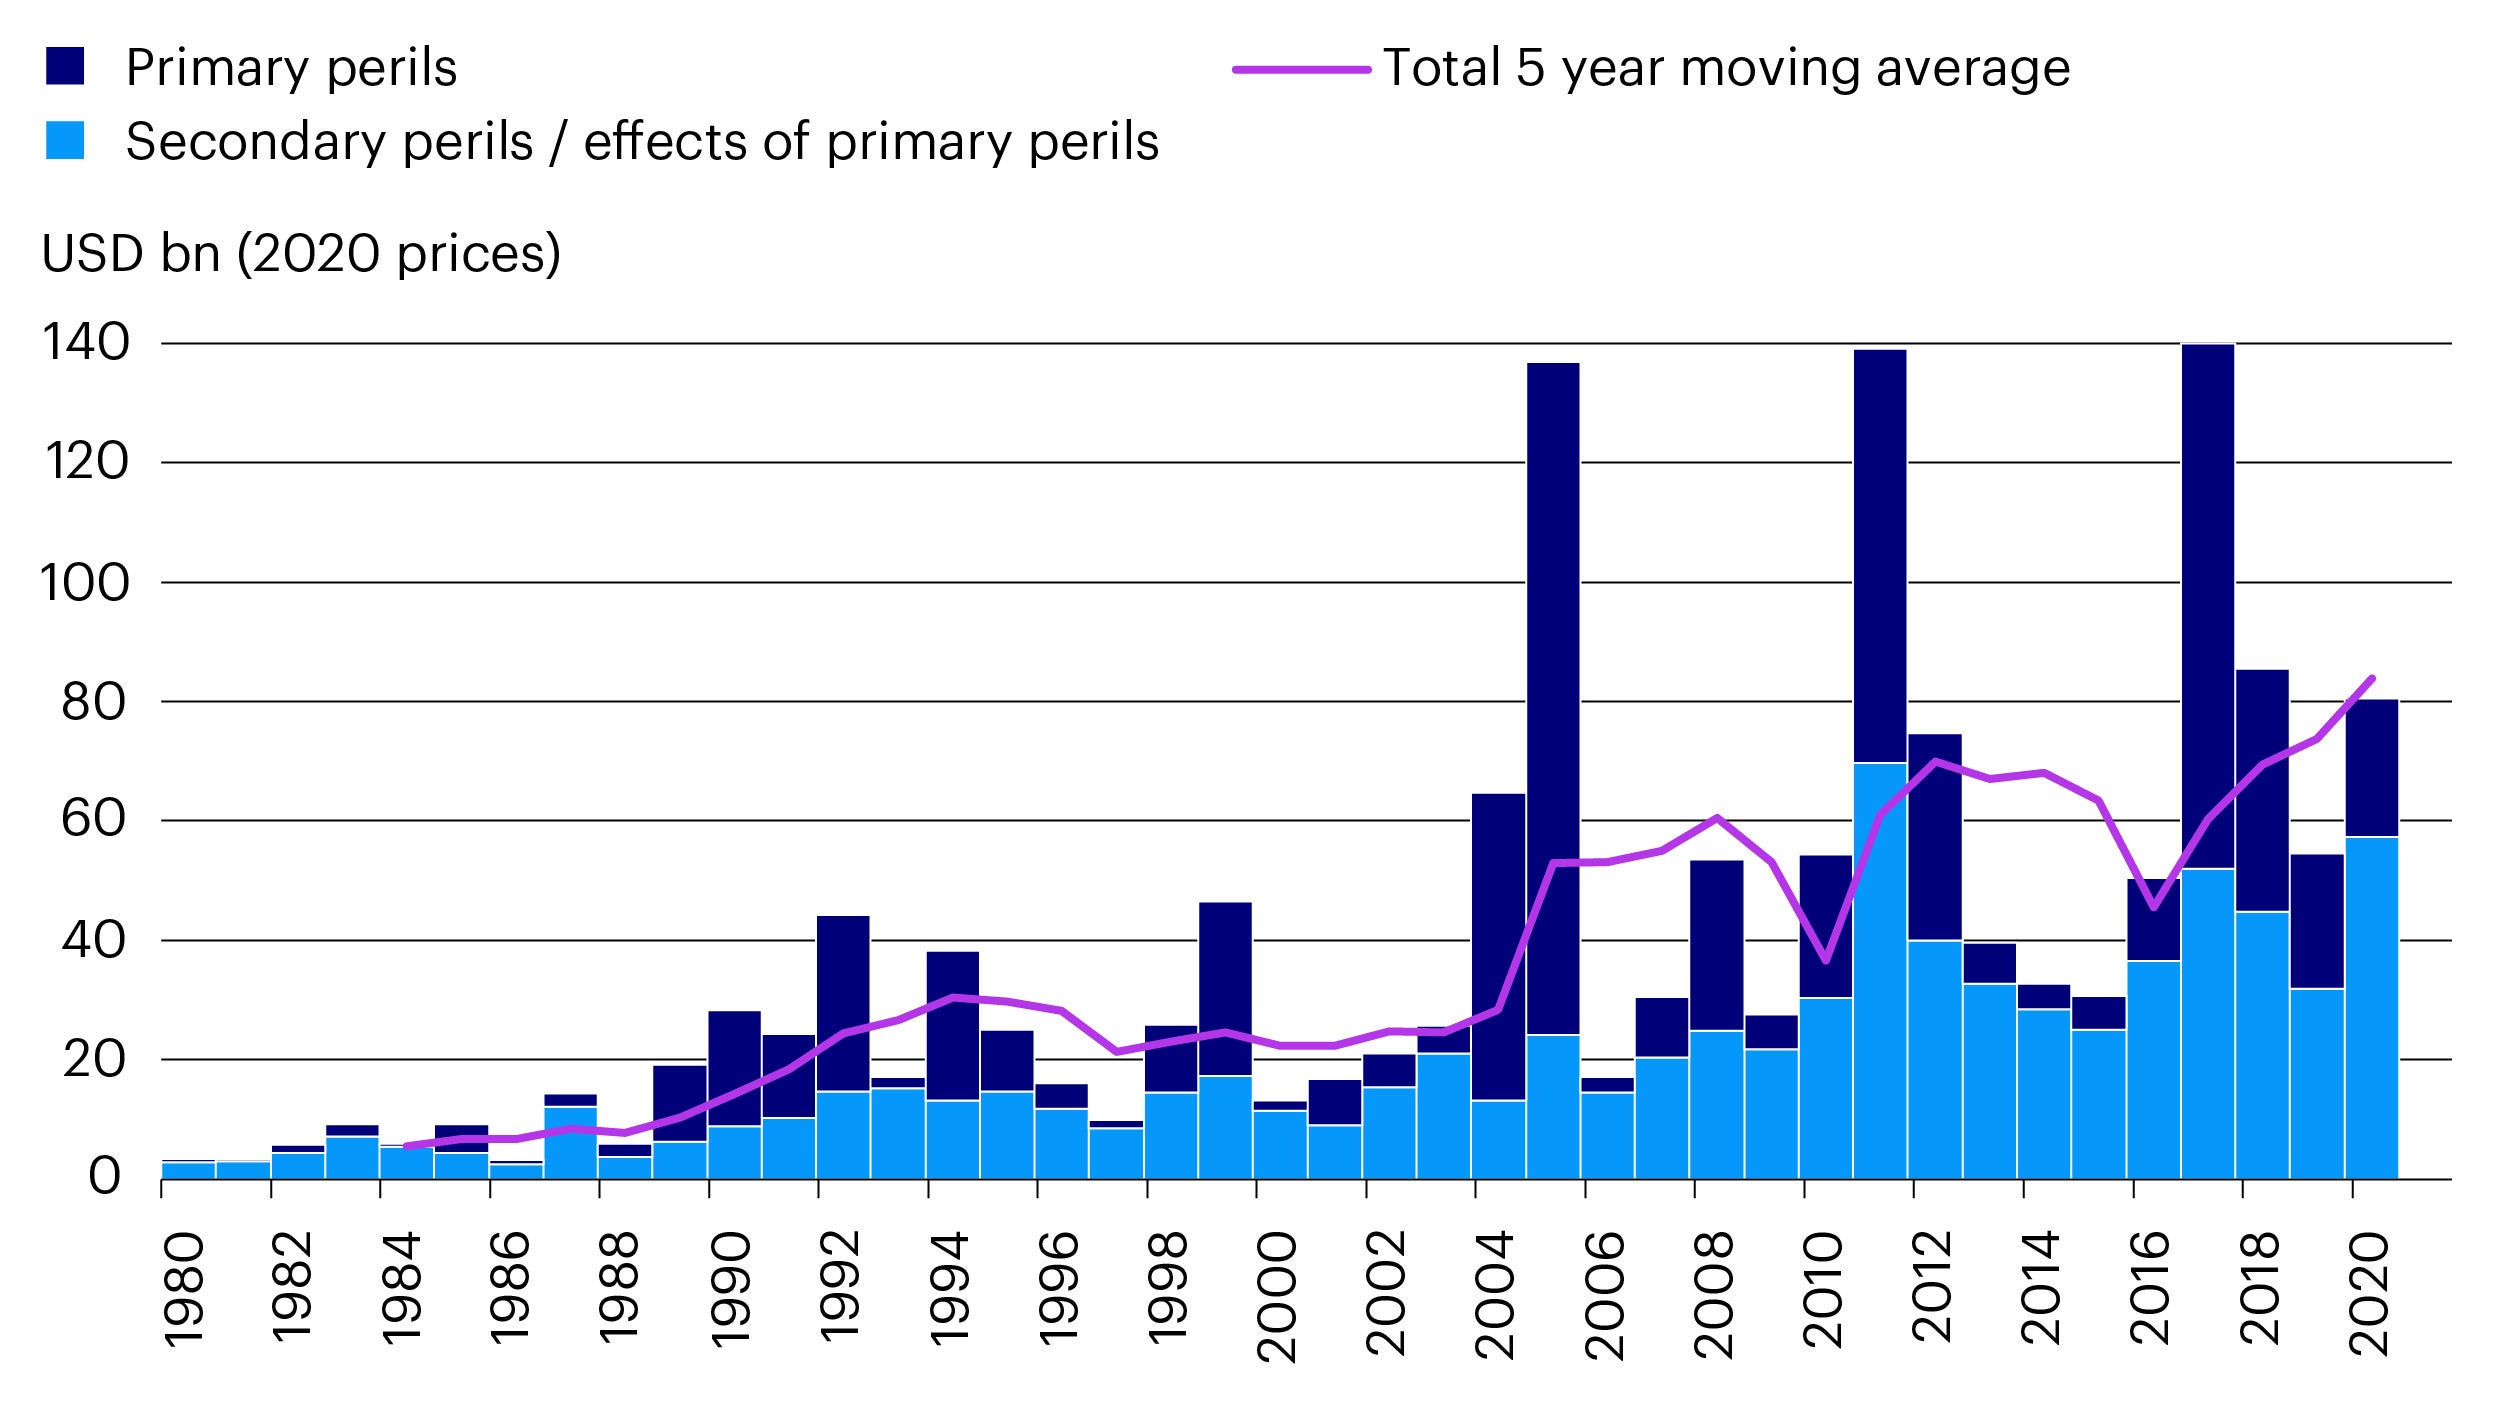
Source: Swiss RE, In 5 charts: natural catastrophes in a changing climate (2021).
Primary perils are natural disasters with known severe loss potential for the insurance industry, such as tropical cyclones or earthquakes.
Secondary perils are smaller to moderate events, or the secondary effects of a primary peril. Examples include river flooding, torrential rainfall, drought, wildfire, thunderstorms and tsunamis.
Real estate and the climate challenge
Real estate is a major contributor to global CO2 emissions.
In 2020, the built environment was estimated to be responsible for 75% of annual global greenhouse gas emissions,1 with buildings alone accounting for about half of this amount.2
Around 50% of emissions from new buildings are embedded in the construction materials. The other half arises from the operation of the building.3
This sets the real estate industry a dual challenge. It needs to create spaces that are more efficient in use while reducing the up-front carbon emissions involved in construction and refurbishment.
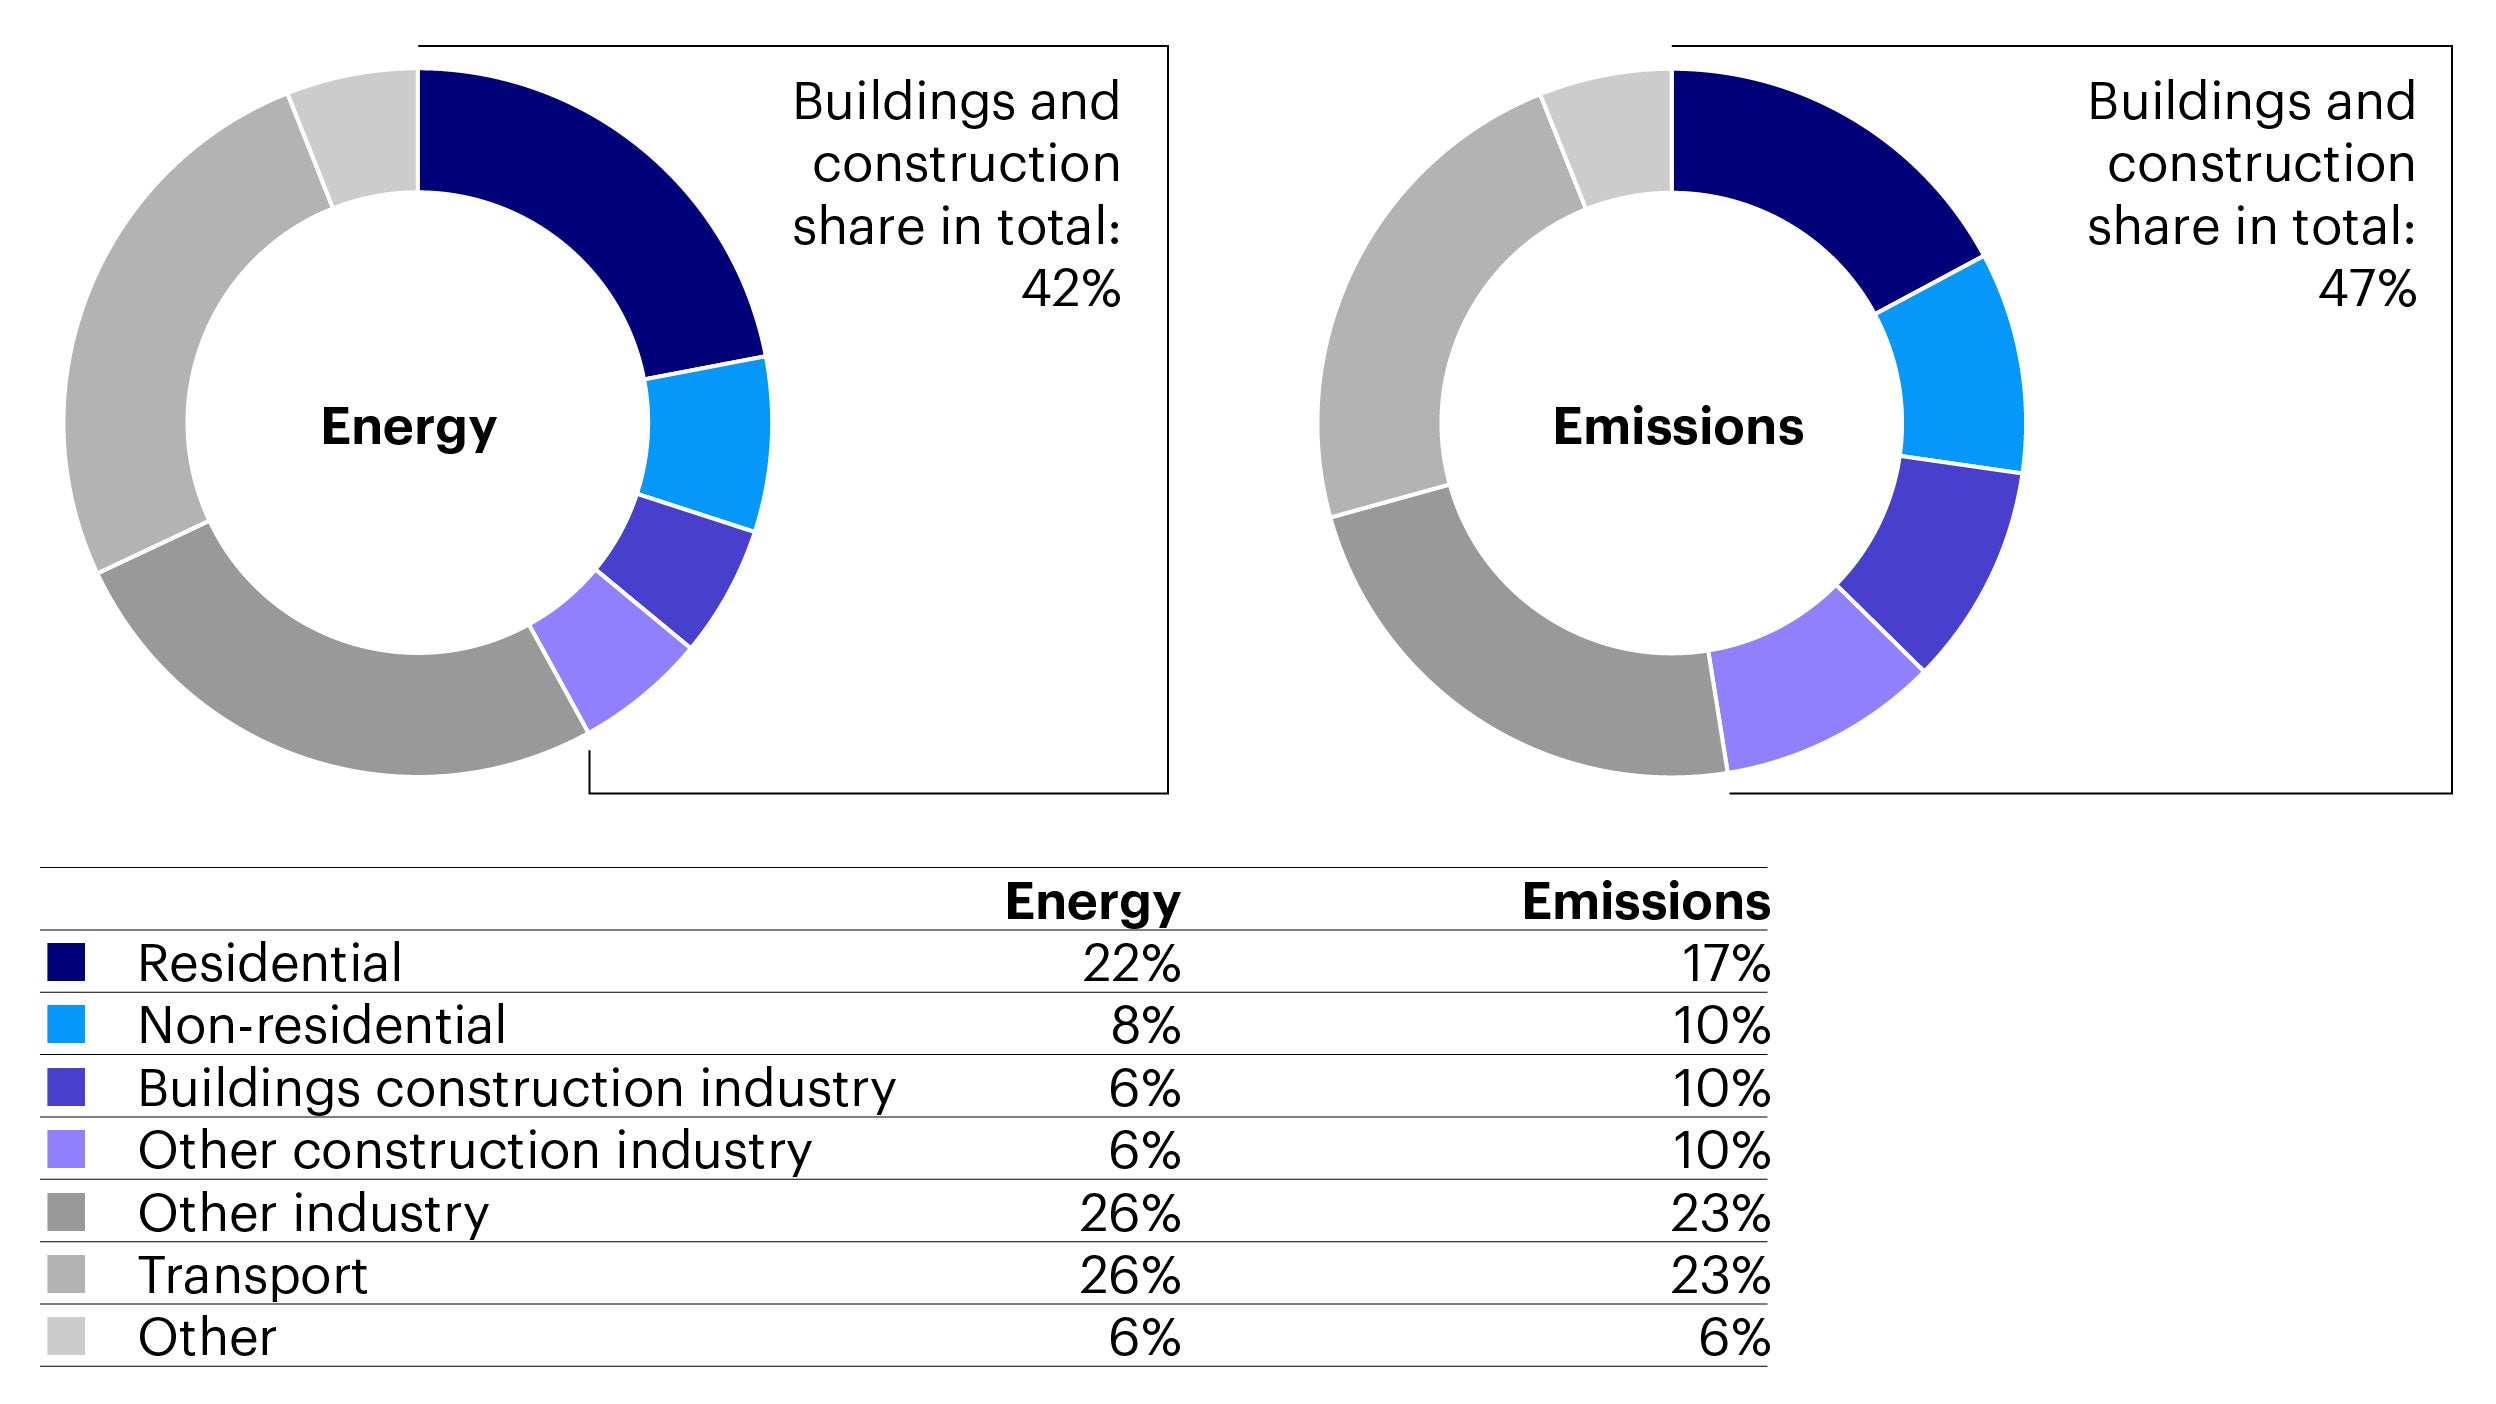
Source: IEA (2021).
Financial impacts of climate risk on real estate
Determining the financial impact of extreme weather on real estate is complex and extends far beyond calculating the potential repair costs of a building.
Climate risk can influence real estate pricing through several channels, with effects varying in severity and longevity.
In the most severe cases, a property could become a stranded asset with its capital value reduced to zero.
A recent report from the United Nations combined the results of multiple scientific studies. It looked at impacts such as reduced rental income, longer re-leasing times, greater cash flow volatility, higher insurance costs, lower capital growth, higher financing rates and reduced liquidity for commercial properties (Table 1).
The report found that better information leads to greater awareness, with climate impacts being integrated into transaction prices.
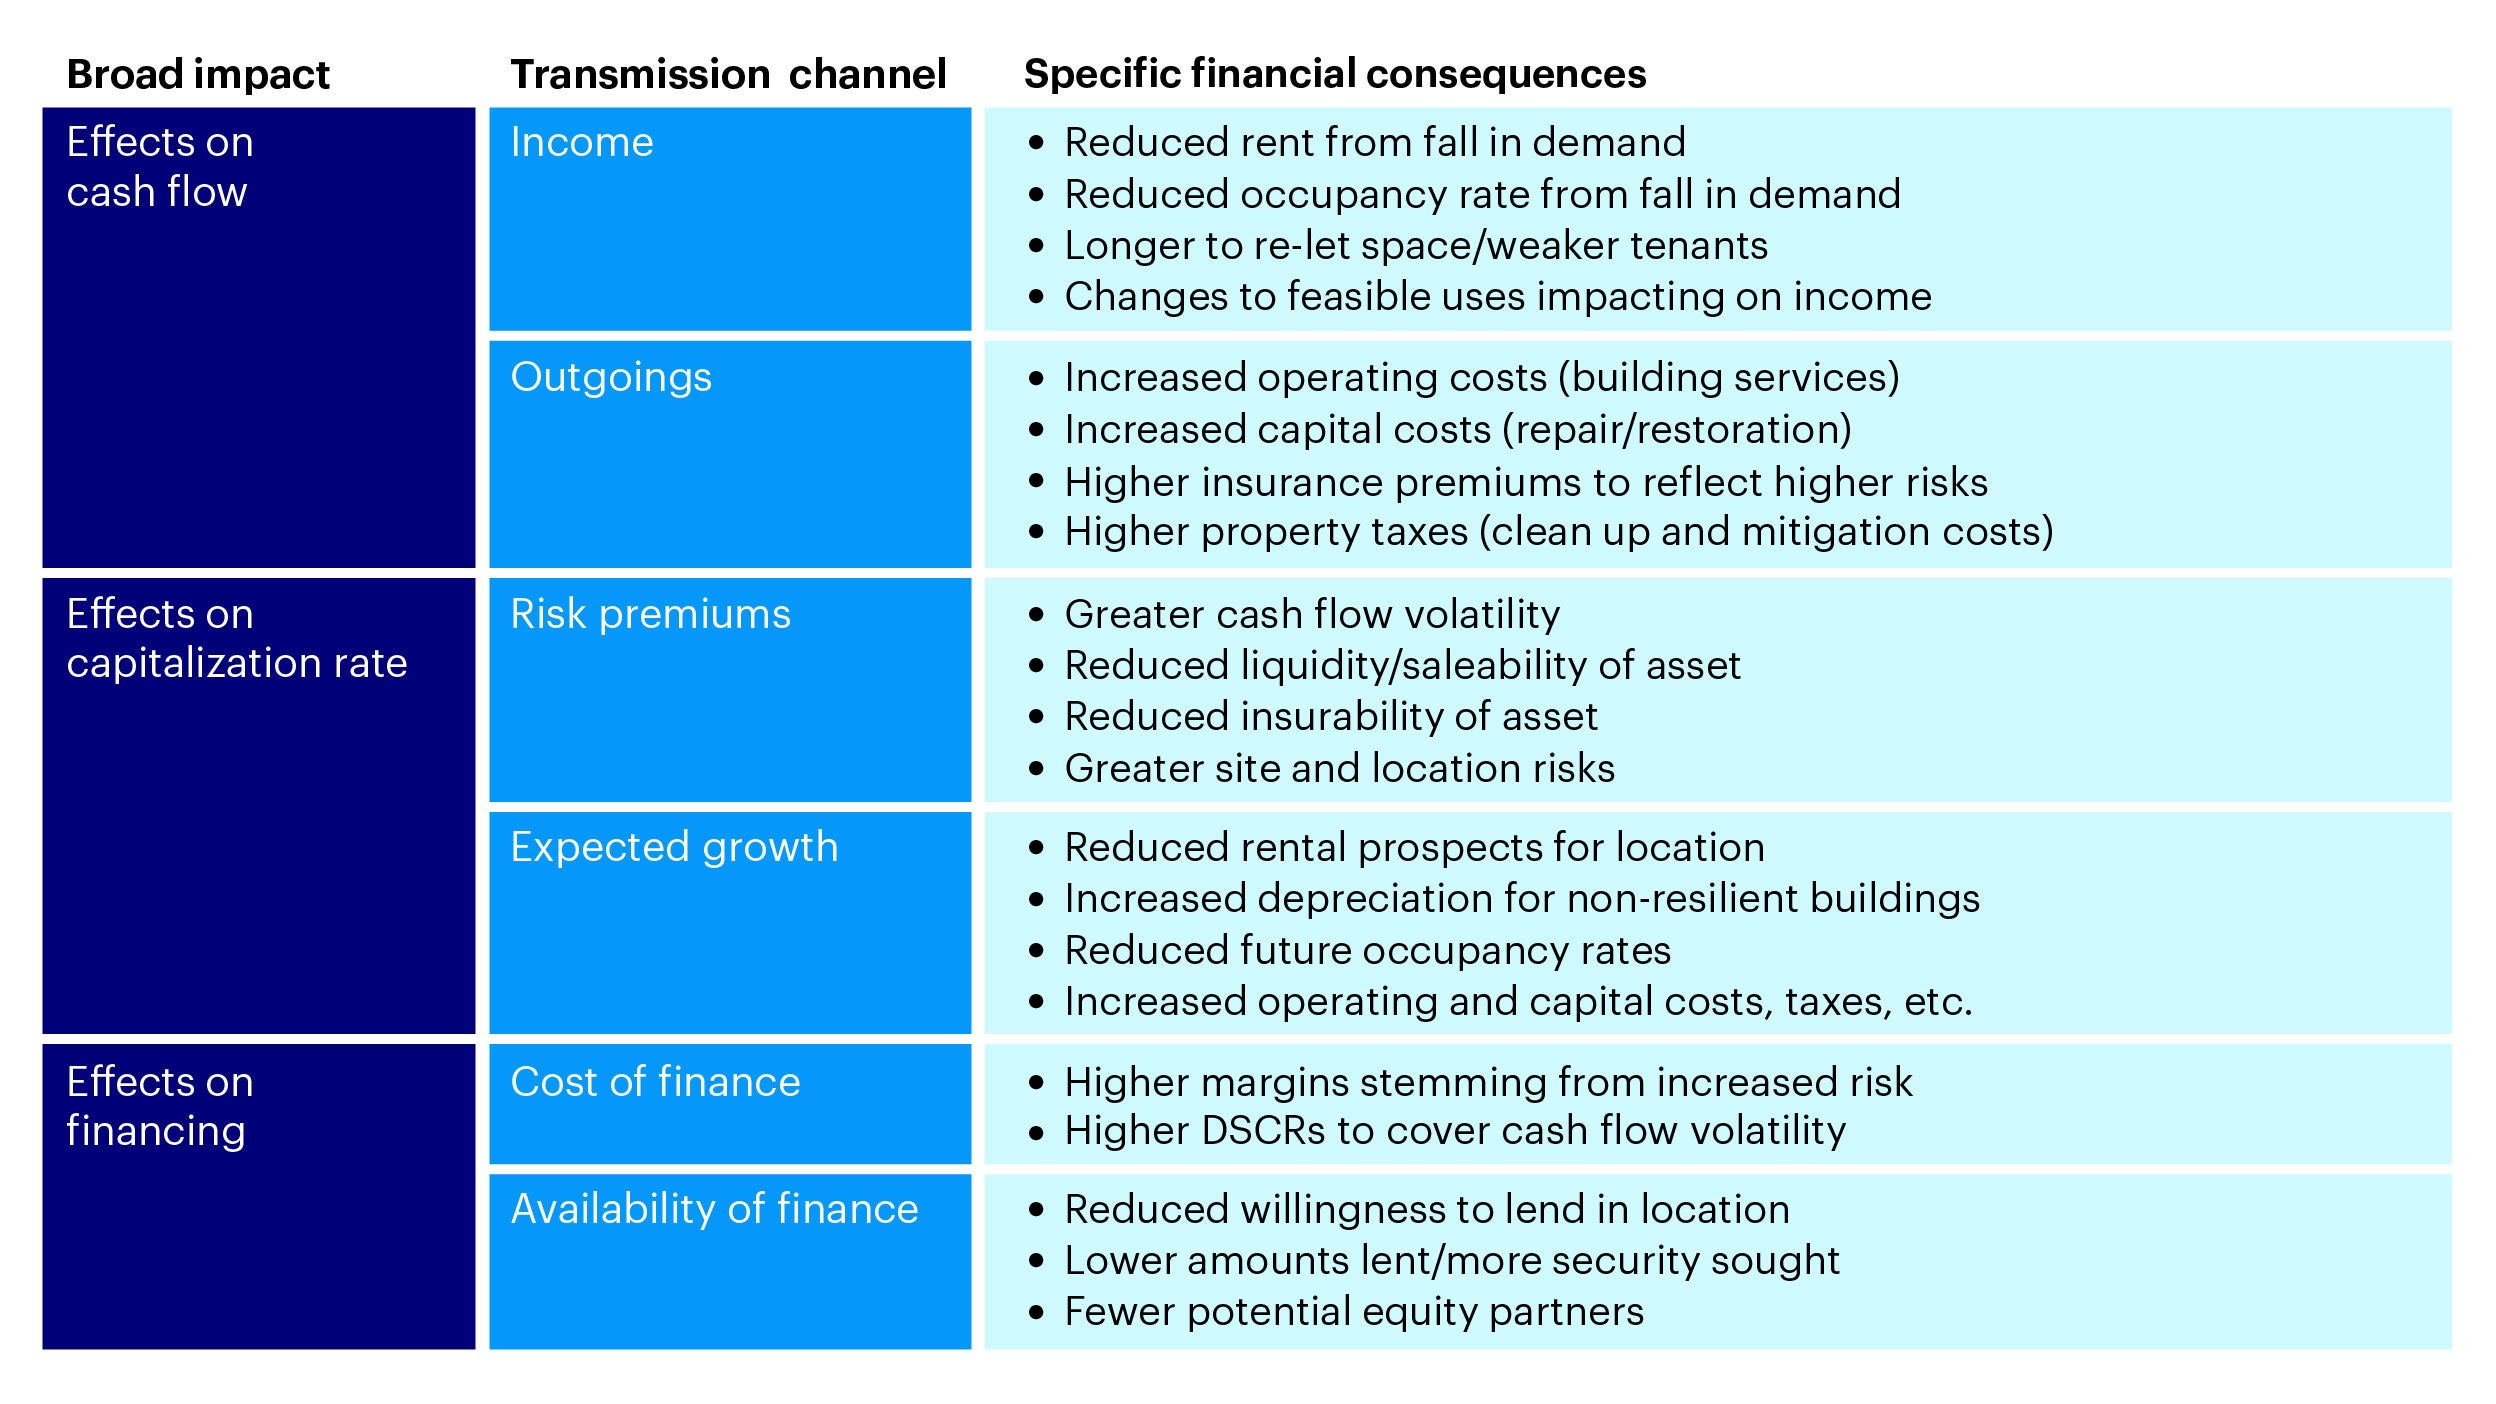
Source: J Clayton, J van de Wetering, S Sayce & S Devaney (2021); UNEPFI report ‘Climate risk and commercial property values: a review and analysis of the literature’.
Measuring climate risk
Traditionally, assessing a location’s vulnerability to future climate events was the remit of a handful of skilled professionals, such as actuaries or academics. It required access to private datasets plugged into specialised software.
Today, awareness of climate risk – and interest in it – is growing. This has broadened the demand for these tools.
Recent advancements in geospatial modelling techniques coupled with the emergence of open-source data and software has helped proliferate the climate risk services available to businesses and organisations.
To understand the exposure of Invesco Real Estate's (IRE's) global property portfolio to climate change risk, we needed a tool which could provide consistent and robust scoring across countries, regions and sectors.
Moody’s ESG Solutions (previously Four Twenty Seven) is a leading provider of physical climate and environmental risk analysis. Its climate risk application is well suited to a globally diversified asset manager like IRE. We introduce its methodology below.
Third-party ESG data
Moody’s methodology is data driven and draws on large public and private databases to generate more than 25 underlying risk indicators. Each of these is linked to a known business consequence of climate change.
Scores are forward-looking and focus on thresholds near the tail end of the risk distribution. This is because such events are the most likely sources of disruption and damage – especially as extreme events grow in severity and frequency.
High level risk indicators in Moody’s service include exposure to floods, heat stress, hurricanes and typhoons, sea level rise, water stress, wildfires, and earthquakes. Earthquakes are a geological hazard rather than a climate risk, but they have also been included in response to client demand.
Moody’s risk scores are standardised (ranging from 0 to 100) and globally comparable. The assigned risk levels (none, low, medium, high, red flag) aid interpretability. For example, a flood risk score of 70/100 is high-risk. It means a location is susceptible to some flooding and inundation during rainfall or riverine flood events.
Subcategory metrics are also available. These include expected flood return period (i.e., flood frequency in years), rainfall intensity and inundation level from a one-in-one-hundred-year flood.
Democratising climate risk data
The Moody’s tool can be used to evaluate climate risk exposure in almost any location across the globe. We can use it for all of IRE’s direct real estate holdings. This equates to more than 500 commercial assets across North America, Asia, Oceania and Europe.
Moody’s subscription-based model allows users to generate location-specific climate risk scorecards. These reports are detailed and valuable. However, at IRE, we have optimised their use by building additional tools to better visualise and disseminate the data.
Previously, the information could not be easily accessed by the wider IRE teams, who did not have a Moody’s ESG login.
To leverage the information for better investment and asset management decision-making, we needed to democratise our climate risk process.
This meant streamlining the delivery of information to our transaction teams (who appraise asset acquisitions) and our fund management teams (who look after existing assets and funds).
The solution found by IRE’s strategic analytics team was a climate risk dashboard. This links directly to Moody’s database and allows users to instantly identify the climate risk exposure of each location they enter.
The dashboard displays the risks that relate to our portfolio assets. It also summarises and filters the risks by fund, using maps and charts to highlight key information.
Benchmarking asset risk
Investments do not exist in a vacuum.
While the clear first step is to democratise the asset-level data, we can gain insight into the relative risk by considering how one investment compares to another. We can achieve this by benchmarking an asset’s climate risk against other locations in the surrounding area.
A well-located property with access to plenty of amenities might see its locational benefits outweigh its climate risk. However, it might be more ideal to own a relatively less risky asset in the same area to minimise the climate risk while enjoying the benefits of the amenities.
We benchmark our assets using Moody’s ESG scoring system, applying it to strategically generated sample points within a boundary of interest (submarket, block group, and so on).
With a series of sample points now available, the scores can be summarised at the defined boundary levels, with individual asset scores placed within the distribution.
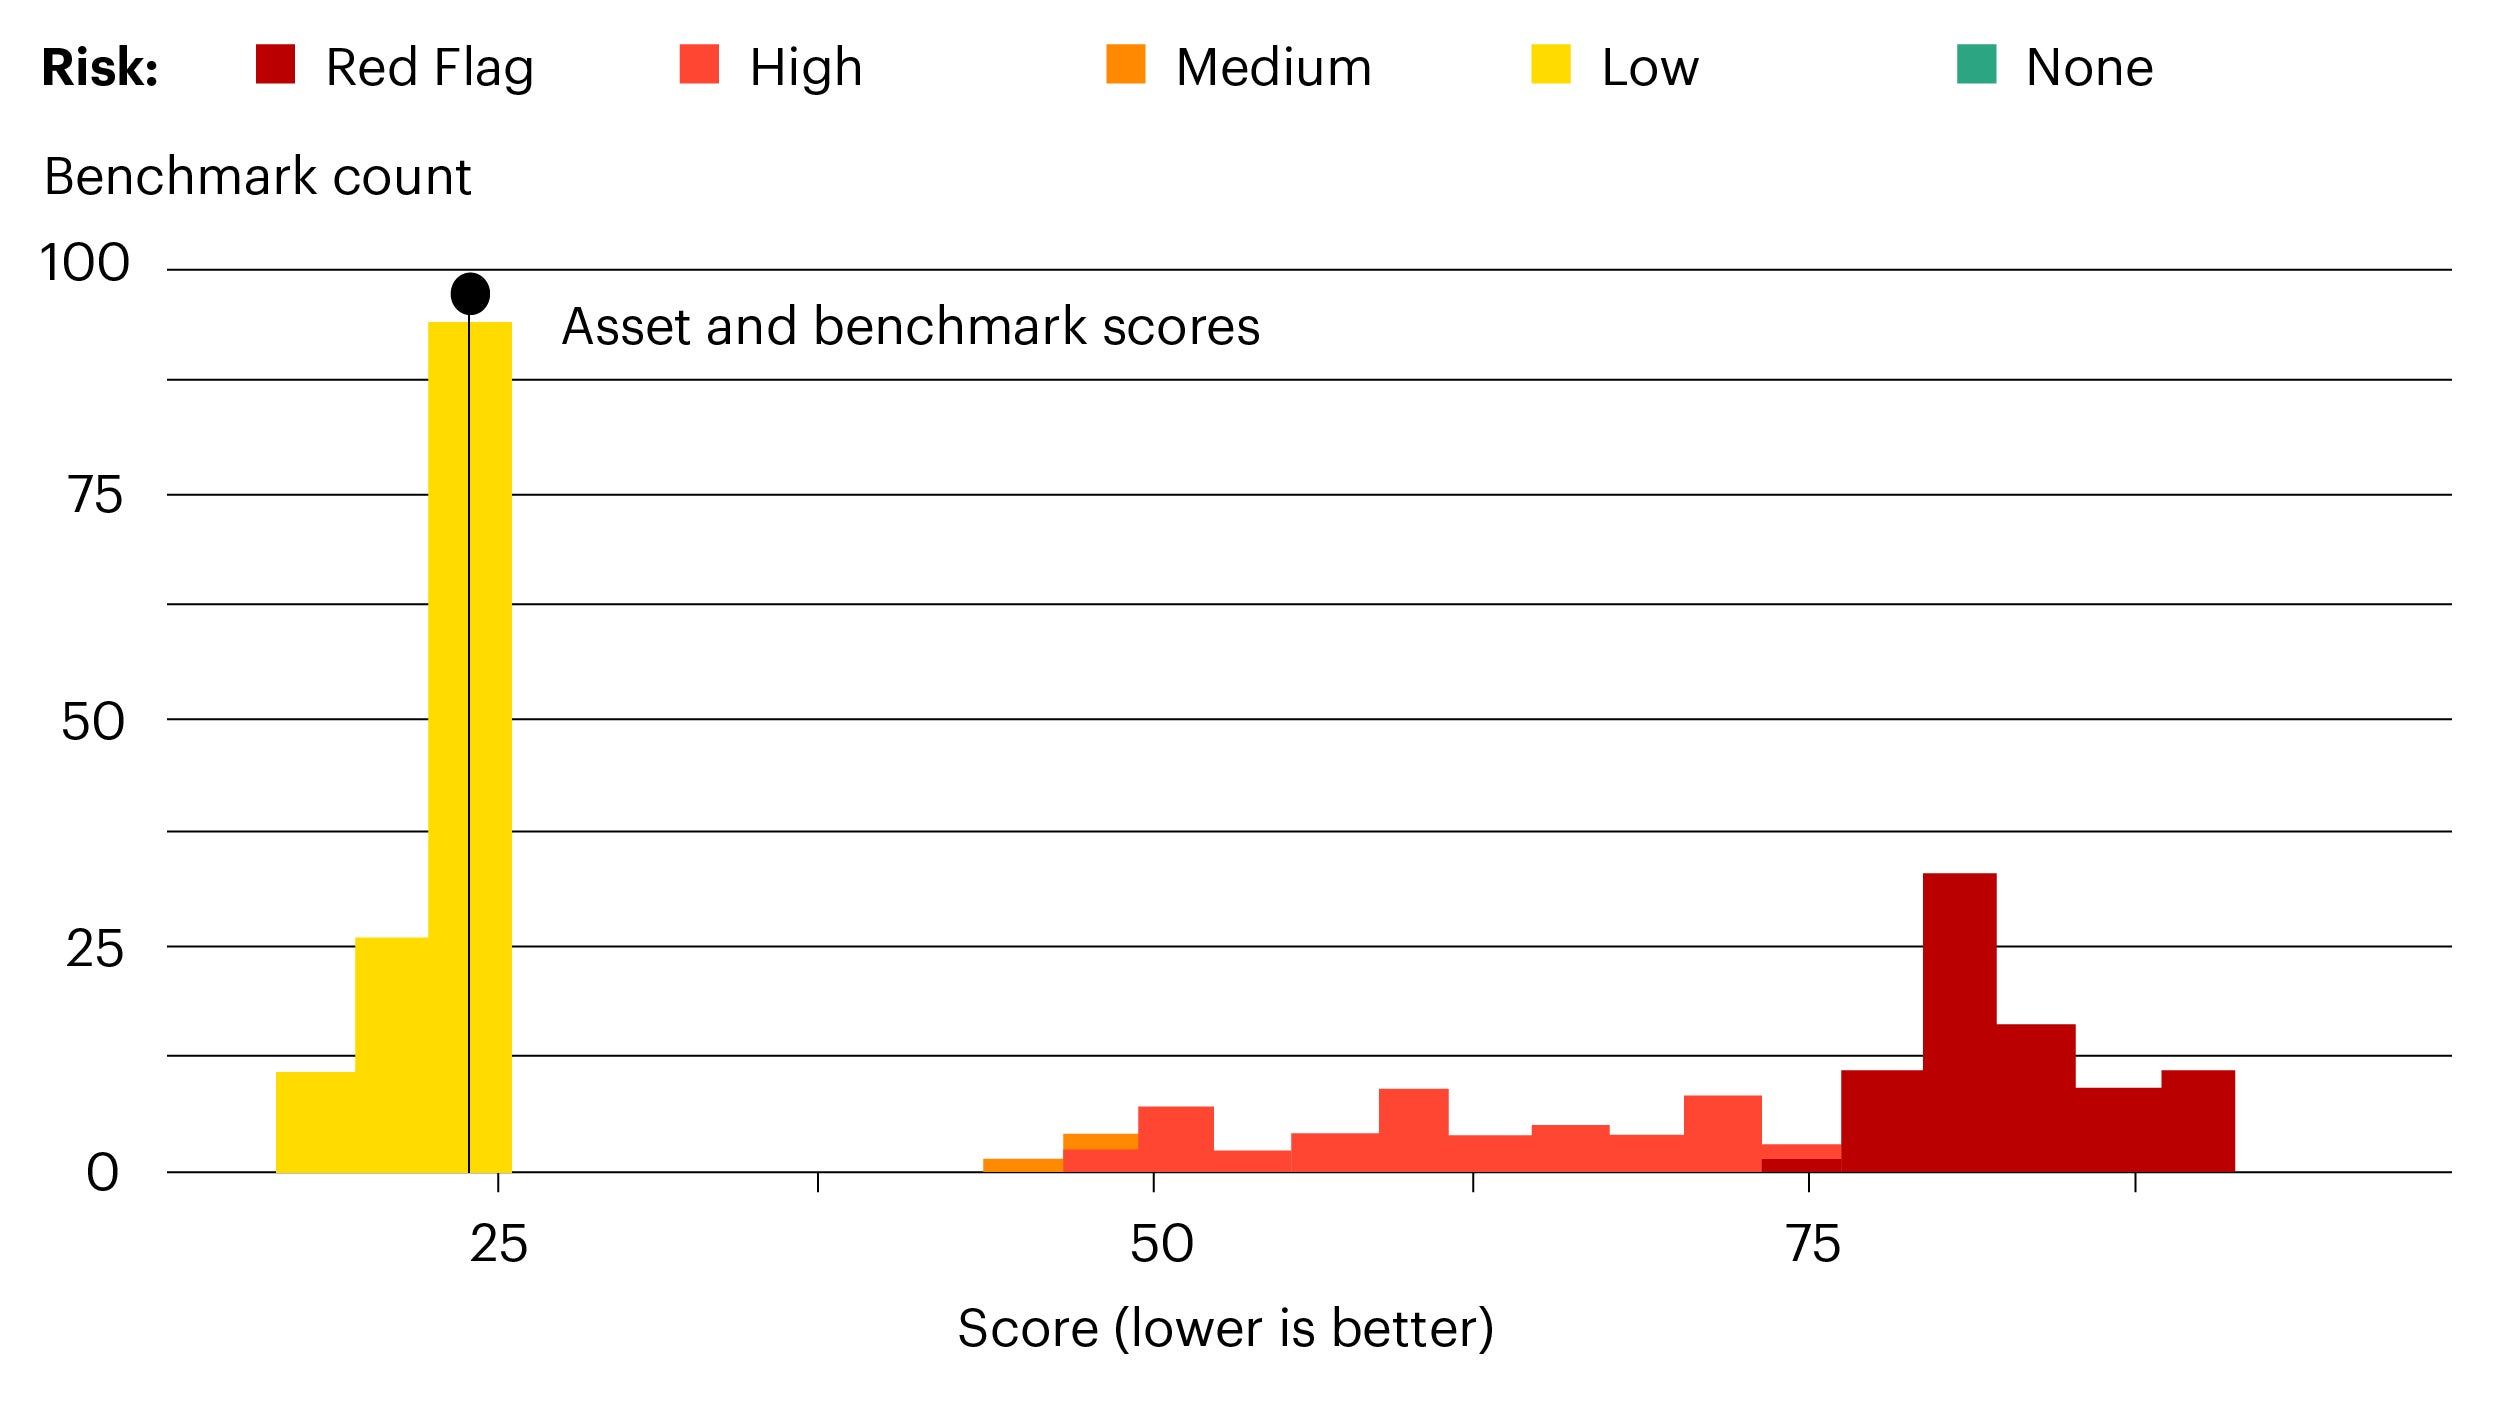
Figure 4 shows a building in Tokyo and how its flood risk compares to the surrounding area. In this location, the low score suggests the asset is not particularly exposed to flood risk.
However, as the distribution in Figure 4 shows, there are parts of Tokyo with high-risk values. This suggests that the sample building is a well-positioned asset, close to amenities, but far enough away from low-lying areas to avoid being too risky.
Source: IRE Strategic Analytics. For illustrative purposes only.
Extreme weather events: two case studies
Finally, we assess the validity and accuracy of Moody’s ESG scores with the help of two case studies.
In the summer of 2021, much of the western part of North America experienced record temperatures, with several areas affected by historic wildfires
We used this real-world example to test Moody’s ESG scores.
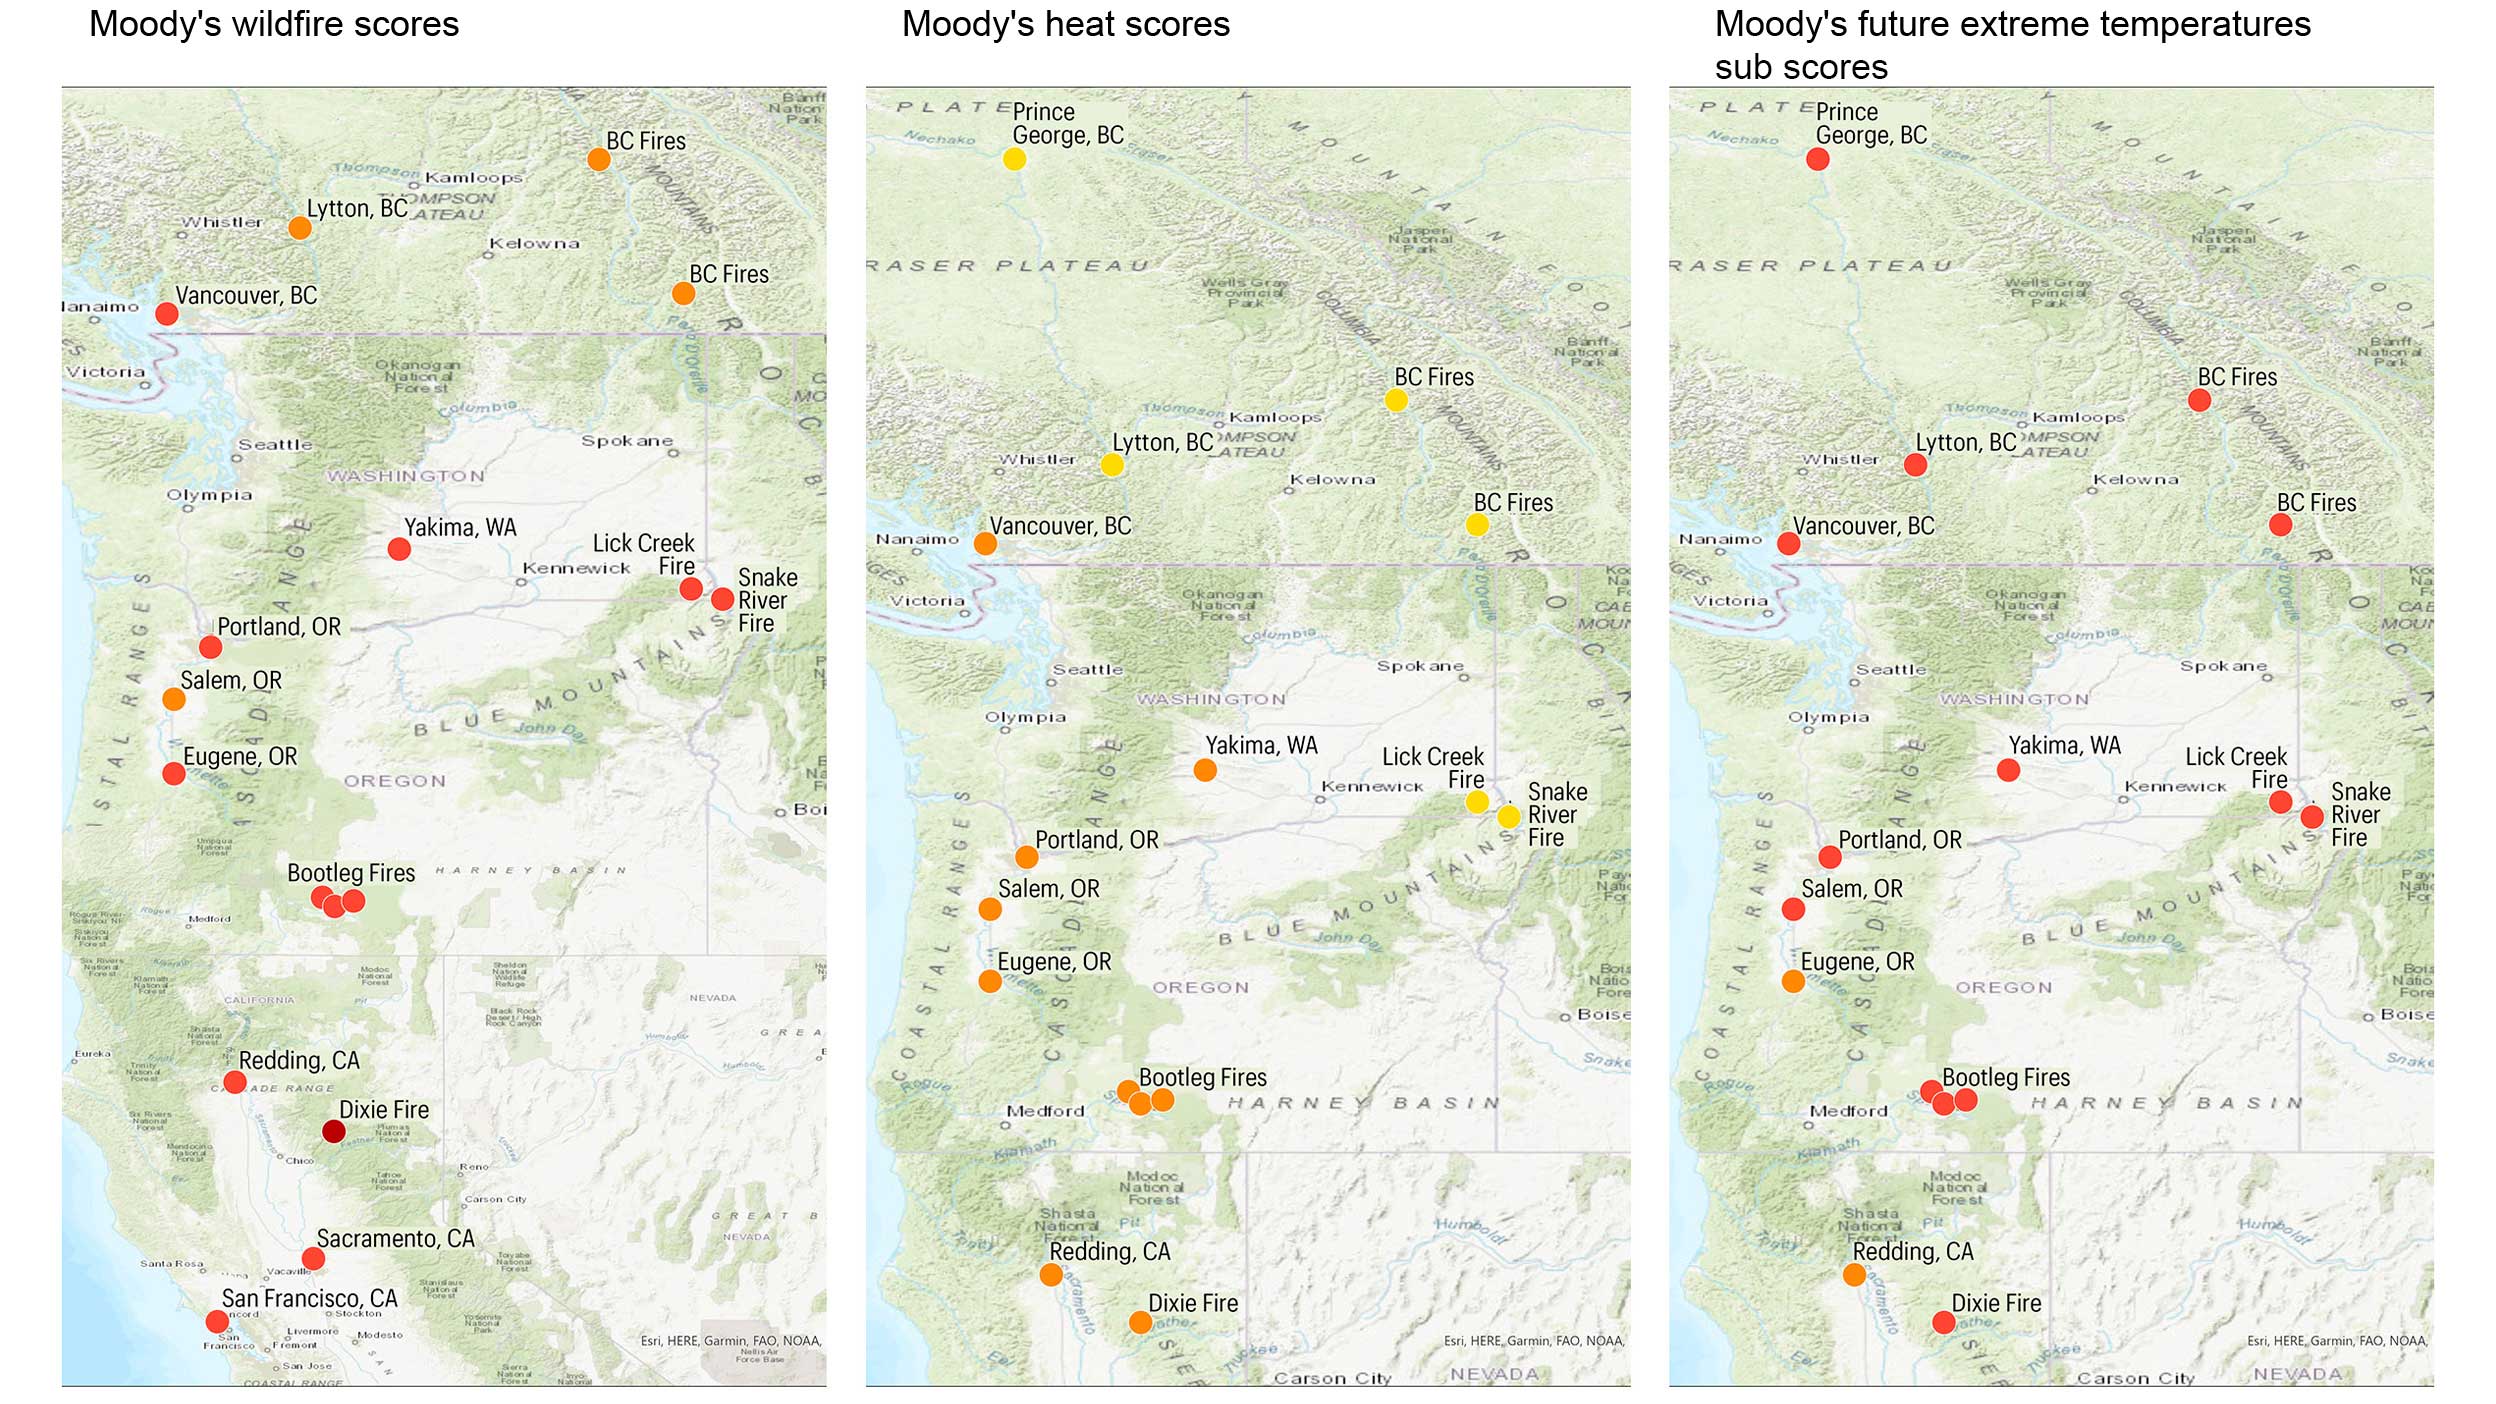
The wildfire scores for locations in the Pacific Northwest proved encouragingly accurate. Apart from medium risk scores in British Columbia, all areas with the largest wildfires had been properly scored as high-risk locations (Figure 5).
We also analysed Moody’s heat scores to see if the record temperatures were something that could have been foreseen.
While overall heat scores (Figure 6) did not seem to be good predictors, the subcategory score for future change in extreme temperatures (Figure 7) seemed to provide a warning that extreme heat is only going to get worse.
This sub-score provides valuable information for investors, and the high scores for future change are supported by the events of the summer of 2021.
In July 2021, several countries in Western Europe experienced extreme flooding.
The worst affected countries included Germany, Belgium, the Netherlands and Austria. A total of 242 deaths were attributed to the flooding, of which 196 were in Germany.
To test the validity of Moody’s ESG scores, we sampled flood risk scores across five towns devastated by the floods (Schönau am Königssee, Hagen, Schuld and Bad Neuenahr in Germany, and Hallein in Austria).
Unsurprisingly, each town had a large river running through its centre.
Almost all the sample points had a high or red flag risk level, if they were at a relatively low elevation or near a river. Equally, those with medium-to-low flood risk were sufficiently distanced from a river or had much higher land elevations.
Source: IRE Strategic Analytics.
Embracing a robust approach
Many real estate investors still ignore extreme weather events, as they are unpredictable and difficult to quantify.
Nonetheless, climate-related events are expected to become more common and more severe. This calls this style of approach into question.
Investors can’t afford to leave climate risk information out of their decision-making processes.
IRE’s climate risk dashboard is designed to deliver timely and reliable information to identify and mitigate, or completely avoid, potential climate risk exposure.
Ultimately, we believe this will help us better preserve and grow capital and deliver stronger and more secure returns for our clients.
Footnotes
-
1 Architecture 2030 (2021) The 2030 Challenge. https://architecture2030.org/2030_challenges/2030-challenge/
2 39% of CO2 emissions according to Architecture 2030; 37% of CO2 emissions and 36% of global energy consumption according to the UN Environment Programme.
3 World Green Building Council (2021) Beyond the Business Case report 2021. https://worldgbc.org/business-case
Investment risks
-
The value of investments and any income will fluctuate (this may partly be the result of exchange rate fluctuations) and investors may not get back the full amount invested.
Important information
-
This is marketing material and not intended as a recommendation to buy or sell any particular asset class, security or strategy. Regulatory requirements that require impartiality of investment/investment strategy recommendations are therefore not applicable nor are any prohibitions to trade before publication.
Where individuals or the business have expressed opinions, they are based on current market conditions, they may differ from those of other investment professionals, they are subject to change without notice and are not to be construed as investment advice.

