Improve your portfolio outcomes with Invesco Fixed Income

The Invesco US Treasury Bond 7-10 Year UCITS ETF aims to provide the total return performance of the Bloomberg U.S. Treasury 7-10 Year Total Return Index USD Unhedged (the "Reference Index"), less the impact of fees. The fund distributes income on a quarterly basis.
Here below you will find a comparative analysis between our Invesco US Treasury Bond 7-10 Year UCITS ETF Dist (TREX IM) and one of the most widely used products on this curve, namely the iShares IBTM IM.
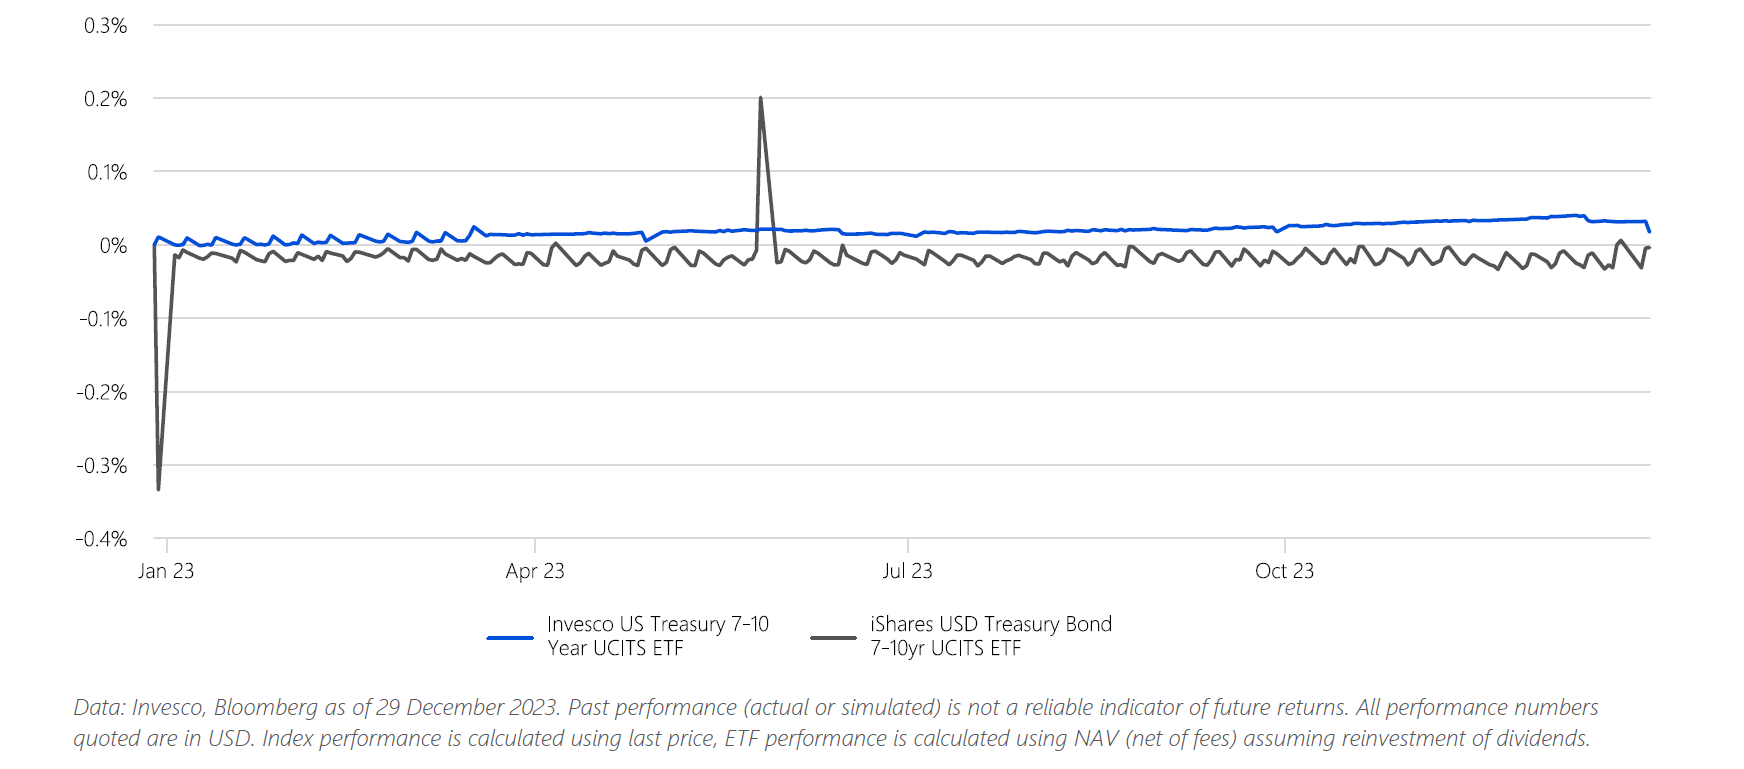
Despite the two benchmarks being different – Bloomberg Barclays U.S. Treasury: 7-10 Year TR Index Value Unhedged USD for Invesco versus ICE U.S. Treasury 7-10 Year Bond Index 4PM for iShares – the products have similar specs, albeit with a significantly different tracking error (as shown in the table and in the chart).
| Product | Ticker | Mgmt Fee (p.a.) | Total Return | Relative Return | Tracking Error |
| Invesco US Treasury 7-10 Year UCITS ETF | TREX IM | 0.06% | 3.57% | 0.02% | 0.05% |
| Bloomberg Barclays U.S. Treasury: 7-10 Year TR Index Value Unhedged USD | LT09TRUU Index | 3.55% | - |
| iShares USD Treasury Bond 7-10yr UCITS ETF | IBTM IM | 0.07% | 3.32% | 0.00% | 0.46% |
| ICE U.S. Treasury 7-10 Year Bond Index 4PM | IDCOT74 Index | 0.06% | 3.32% | - |
Data: Invesco, Bloomberg as of 29 December 2023. Past performance (actual or simulated) is not a reliable indicator of future returns. All performance numbers quoted are in USD. Index performance is calculated using last price, ETF performance is calculated using NAV (net of fees) assuming reinvestment of dividends.

Invesco US Treasury Bond 7-10 Year UCITS ETF Dist (TREX IM) has outperformed iShares IBTM IM both in absolute terms (3.57% vs 3.32%) and vs respective benchmark (+0.02% vs -0.00%)
This outperformance is primarily attributed to our securities lending activity. However, both products feature physical replication with a different securities lending program. Our program aims to reinvest 90% of the profits back into the ETF.
In addition, our unhedged product has a lower OCF compared to iShares (6bps vs 7bps) and lower TE mainly due to the fact that our PMs aligned the NAV methodology to match index treatment of accruals in April last year. Our performance has become smoother since then and our TE has improved slightly.
Attached, you will find the Tracking Error Comparison analysis from our Capital Market team regarding the two ETFs in question.
Invesco US Treasury 7-10 Year UCITS ETF is available on Borsa Italiana:
| ETF Products | Ticker | Base Ccy | Mgmt Fee (p.a.) |
| Invesco US Treasury Bond 7-10 Years UCITS ETF Dist (physical) | TREX IM | USD | 0.06% |
| Invesco US Treasury Bond 7-10 Years UCITS ETF EUR Hdg Dist (physical) | TRXE IM | EUR | 0.10% |

