Flexibility, scope and risk awareness in bond markets

The Invesco Tactical Bond Fund (UK) is our investment philosophy distilled into a single fund. It’s designed to allow us to align risk to reward, both the level and the type, across bond markets as the opportunity set changes. In that way we aim for attractive risk-adjusted returns and to achieve income and capital growth over time.
The key characteristics of the fund are flexibility, scope and risk-awareness. We are happy to take risk and to change the portfolio quickly. We are also able to invest right across the bond market and in all bond risk factors. And we are prepared to de-risk – passing up short-term income to maintain the right balance. Please refer to the fund’s investment risks at the end of the article.
Flexibility
The Invesco Tactical Bond Fund (UK) has very few restrictions. It sits in the IA Sterling Strategic Bond sector and can hold all types of bond within wide ranges.¹ It can actively manage duration, credit, yield curve and currency, using derivatives to gain exposure as well as to hedge risk.
We use this flexibility. Over the life of the fund our allocation to cash and high-quality government bonds (liquidity) has ranged from 12% to 67%. At times we have held virtually no high yield corporate bonds, but the allocation has also been as high as 30%. Similarly, peripheral eurozone government bonds have been between 0% and 25%.
We can also make changes quickly when yields and spreads are volatile. At the start of this year, for example, we held just 13 investment grade corporate bonds, less than 9% of the fund. This was increased to over 100 bonds representing 24% of the fund in June. We have since taken profits on some of these positions reducing the exposure back down to a 17% position through 69 bonds by 28 February 2021.
Scope
We operate across the global bond market and have the ability and resources to manage a range of markets and risk factors.
The top 20 positions in the fund at the end of February 2021 included bonds from three governments, six corporate issuers, eight bank debt instruments and an interest rate-related derivative. The fund had exposure to 25 countries² and bonds with credit ratings ranging from AAA (7%) to CCC and below (1.6%).
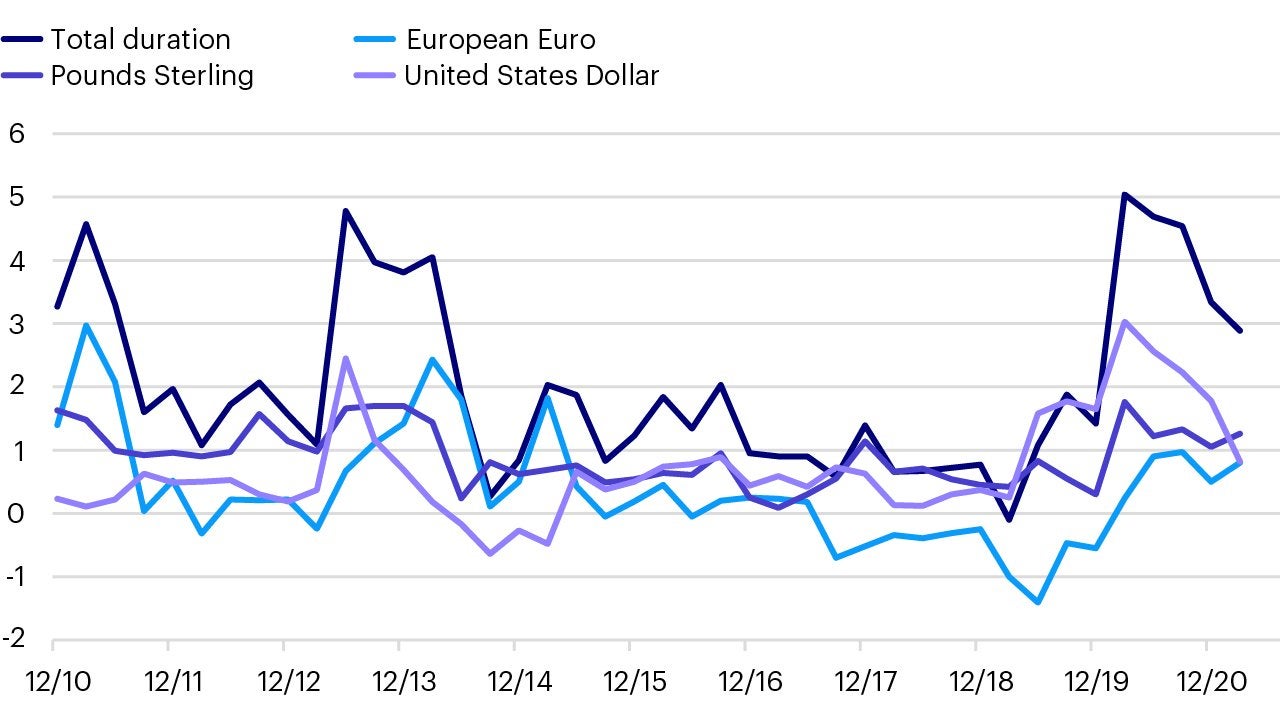
Duration is also managed across multiple markets, with the same aim of isolating and exploiting attractive risk / reward profiles. The chart below shows the breakdown of fund duration by currency bloc over the life of the fund.

We have held negative exposure to single markets (and sometimes at the total fund level), most obviously in the EUR market, offset by higher exposure to USD duration. This positioning has helped performance in recent quarters as the gap between the treasury and bund curves has narrowed.
Risk-awareness
To carry out the fund’s mandate, we think it’s necessary to be willing to reduce significantly the total risk of the portfolio when markets do not offer enough value. This means foregoing some of the yield that the market is offering to mitigate the downside. Clients need to understand this feature of the fund and we have tried to make it explicit by choosing a cash-like index as the performance reference benchmark.
Over the history of the fund, a period when interest rates and credit spreads have reached historic lows at several points, we have reduced total fund duration to zero and below, we have brought exposure to AAA-rated assets as high as 37% and pure cash to 20%. But we have also been prepared to ‘re-risk’ the fund quickly, not least in the early life of the fund, coming out of the financial crisis, and during 2020, when we shifted a significant portion of the fund into credit risk in reaction to the much higher yields on offer since March 2020.
Performance review - A less volatile path
Over the last three years, the fund has often maintained a relatively low risk profile, both in credit and term risk. There have also been periods, such as the end of 2018 and since March 2020, when it has taken on risk.
Both the limited risk and the diversification of the fund are reflected in the less volatile NAV path throughout these years. Coming into the Covid crisis with a relatively low-risk portfolio also meant that the fund experienced a much smaller drawdown than any of these markets in the stressed conditions of February and March, with a peak to trough decline of -7%. The drawdown for sterling investment grade credit was -14%, for European high yield -22% and for gilts -11%. The addition of risk following the sell-off has allowed us to benefit from the recovery.
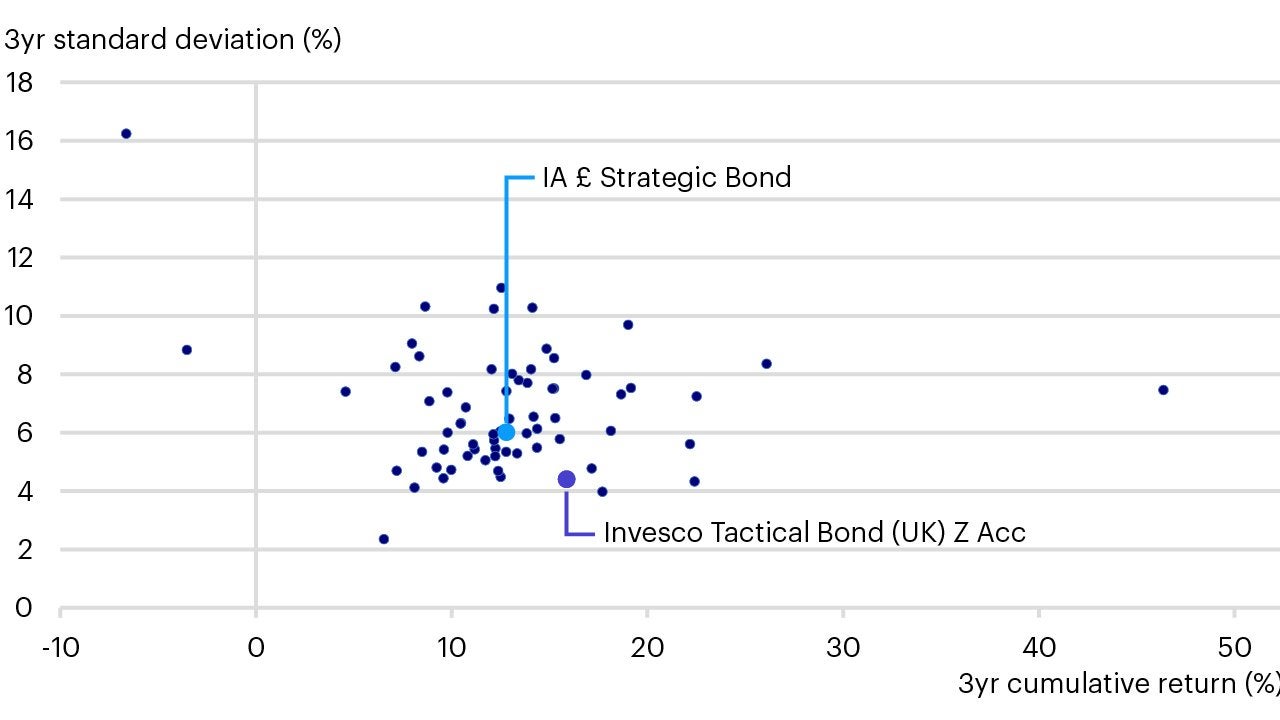
The best way to express the benefit of the fund for investors in this three year period is through risk-adjusted returns. Data from Lipper shows that our three year return to the 28 February 2021 is 307bps ahead of the sector average for strategic bond funds. Importantly, this outperformance comes with a lower level of volatility. The fund’s standard deviation for this period was 4.41% compared to a 6.02% average. This is one of the lowest in the sector.

The Invesco Tactical Bond Fund (UK) fulfils a particular mandate. It is flexible – about how much risk to take and where to take it. It can be changed quickly, into different securities, different markets and different risk factors. It looks for investments where the yield is a good reward for the risk. It can sometimes be quite defensive uninvested. As such, it does not suit every investor, but we think it does something distinctive and it can be a valuable fund for investors to have at their disposal.
Standardised Rolling 5-year returns (%)
| 29-02-2016 28-02-2017 | 28-02-2017 28-02-2018 | 28-02-2018 28-02-2019 | 28-02-2019 29-02-2020 | 29-02-2020 28-02-2021 | |
|---|---|---|---|---|---|
| Invesco Tactical Bond Fund (UK) | 5.36 | 1.90 | -0.91 | 4.83 | 11.55 |
| 3-Month UK T-Bills | 0.25 | 0.26 | 0.63 | 0.74 | 0.07 |
| IA Strategic Bond | 9.78 | 2.35 | 0.77 | 7.85 | 3.78 |
| Quartile | 4 | 3 | 4 | 4 | 1 |
| ICE BofAML European Currency High Yield | 13.55 | 4.75 | 0.79 | 5.58 | 5.61 |
| ICE BofAML Sterling Corporate | 14.13 | 1.47 | 1.79 | 11.62 | 2.11 |
| ICE BofAML Gilts | 6.37 | -1.23 | 2.61 | 12.63 | -4.25 |
Past performance is not a guide to future returns.
Performance figures are based on the Z Accumulation share class. As this was launched on 12 November 2012, for the periods prior to this launch date, performance figures are based on the accumulation share class, without any adjustment for fees. Performance figures for all share classes can be found in the relevant Key Investor Information Document. Performance figures are shown in sterling, inclusive of reinvested income and net of the ongoing charge and portfolio transaction costs as at 28 February 2021. Sector average performance is calculated on an equivalent basis. The standardised past performance information is updated on a quarterly basis. Source: Lipper.
UK 3 Month Treasury Bills is a Comparator Benchmark. Given its asset allocation the Fund’s performance can be compared against the Benchmark. However, the Fund is actively managed and is not constrained by any benchmark.
ICE BofA index data as at 28 February 2020. European currency high yield returns are shown in local currency.
Footnotes
-
¹ The IA Sterling Strategic Bond sector is not the fund’s comparator, target or restraining benchmark. The fund’s comparator benchmark is UK 3 Month Treasury Bills. The fund is actively managed and is not constrained by this benchmark.
² By country of risk.
Investment risks
-
The value of investments and any income will fluctuate (this may partly be the result of exchange-rate fluctuations) and investors may not get back the full amount invested.
The securities that the Fund invests in may not always make interest and other payments nor is the solvency of the issuers guaranteed. Market conditions, such as a decrease in market liquidity for the securities in which the Fund invests, may mean that the Fund may not be able to sell those securities at their true value. These risks increase where the Fund invests in high yield or lower credit quality bonds. As the fund can rapidly change its holdings across the fixed income and debt spectrum and cash, this can increase its risk profile. The fund has the ability to make significant use of financial derivatives (complex instruments) which may result in the fund being leveraged and can result in large fluctuations in the value of the fund. Leverage on certain types of transactions including derivatives may impair the fund’s liquidity, cause it to liquidate positions at unfavourable times or otherwise cause the fund not to achieve its intended objective. Leverage occurs when the economic exposure created by the use of derivatives is greater than the amount invested resulting in the fund being exposed to a greater loss than the initial investment.
The fund may be exposed to counterparty risk should an entity with which the fund does business become insolvent resulting in financial loss. The fund may invest in contingent convertible bonds which may result in significant risk of capital loss based on certain trigger events. The fund’s performance may be adversely affected by variations in interest rates. The fund has the ability to invest more than 35% of its value in securities issued by a single government or public international body.
Important information
-
All data is as at 28/02/2021 and sourced from Invesco unless otherwise stated.
Where individuals or the business have expressed opinions, they are based on current market conditions, they may differ from those of other investment professionals and are subject to change without notice. This document is marketing material and is not intended as a recommendation to invest in any particular asset class, security or strategy. Regulatory requirements that require impartiality of investment/investment strategy recommendations are therefore not applicable nor are any prohibitions to trade before publication. The information provided is for illustrative purposes only, it should not be relied upon as recommendations to buy or sell securities.
For the most up to date information on our funds, please refer to the relevant fund and share class-specific Key Investor Information Documents, the Supplementary Information Document, the Annual or Interim Reports and the Prospectus, which are available using the contact details shown.

