Small cap, big picture

Key takeaways
Business cycle
Inflation
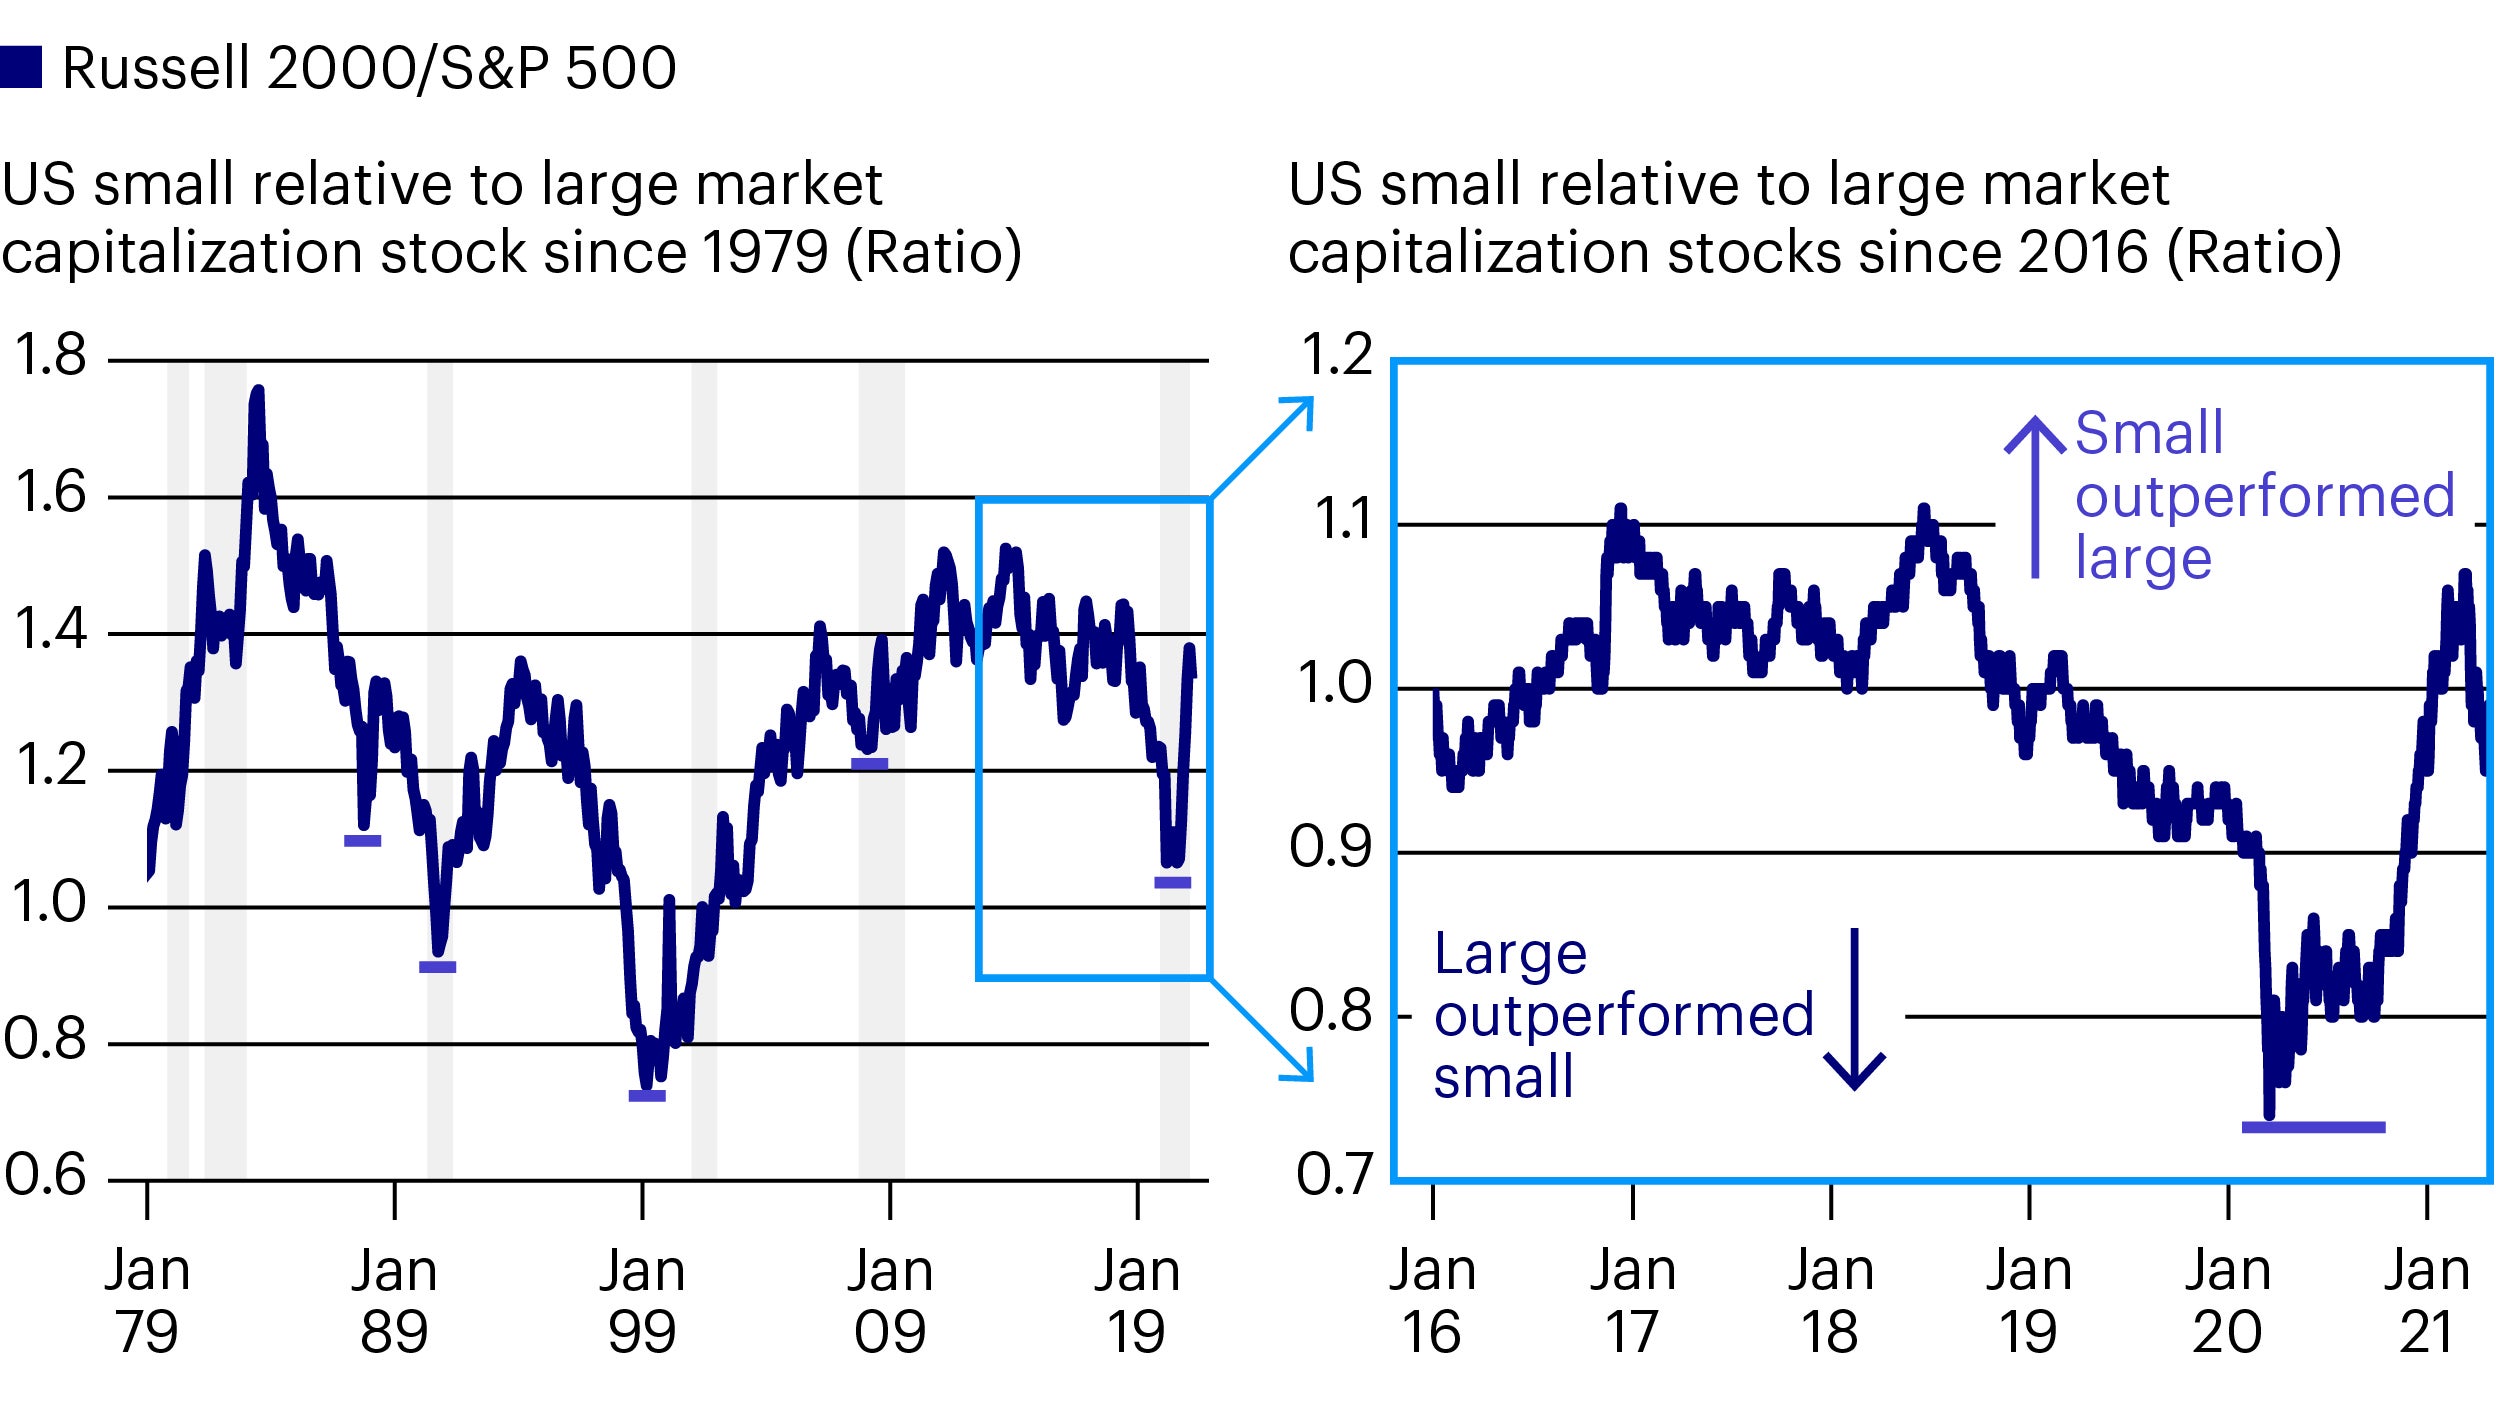
Historically, equity portfolios with a small market capitalization tilt (favoring high-growth companies and riskier, less-liquid stocks) usually outperformed those with a large-cap bias (emphasizing stable, high-quality companies and liquid stocks) for several years into a new business cycle. Said differently, company size was a play on improving economic prospects (Figure 1).
Initially, small caps gain traction in an environment of abundant central bank liquidity, improving credit conditions, tightening credit spreads, ebbing volatility, shrinking risk premia, as well as investors’ penchant for cyclicality and thirst for higher returns. If any of that sounds familiar, those are the exact conditions supporting small caps today.

The next stage of significant small-cap outperformance may likely require the support of an expanding economy, rebounding corporate profits and declining default rates, all of which appear to be in the offing. As for large caps, they generally do well in the mid to later stage of the business cycle, but I think those times are well ahead of us.
How much longer can the small-cap trade last?
Given such a powerful move in “risk” assets – including small caps – off their early-2020 lows, many investors are naturally wondering how long the “risk-on” trade can last. Should they be selling the rallies or buying the dips?
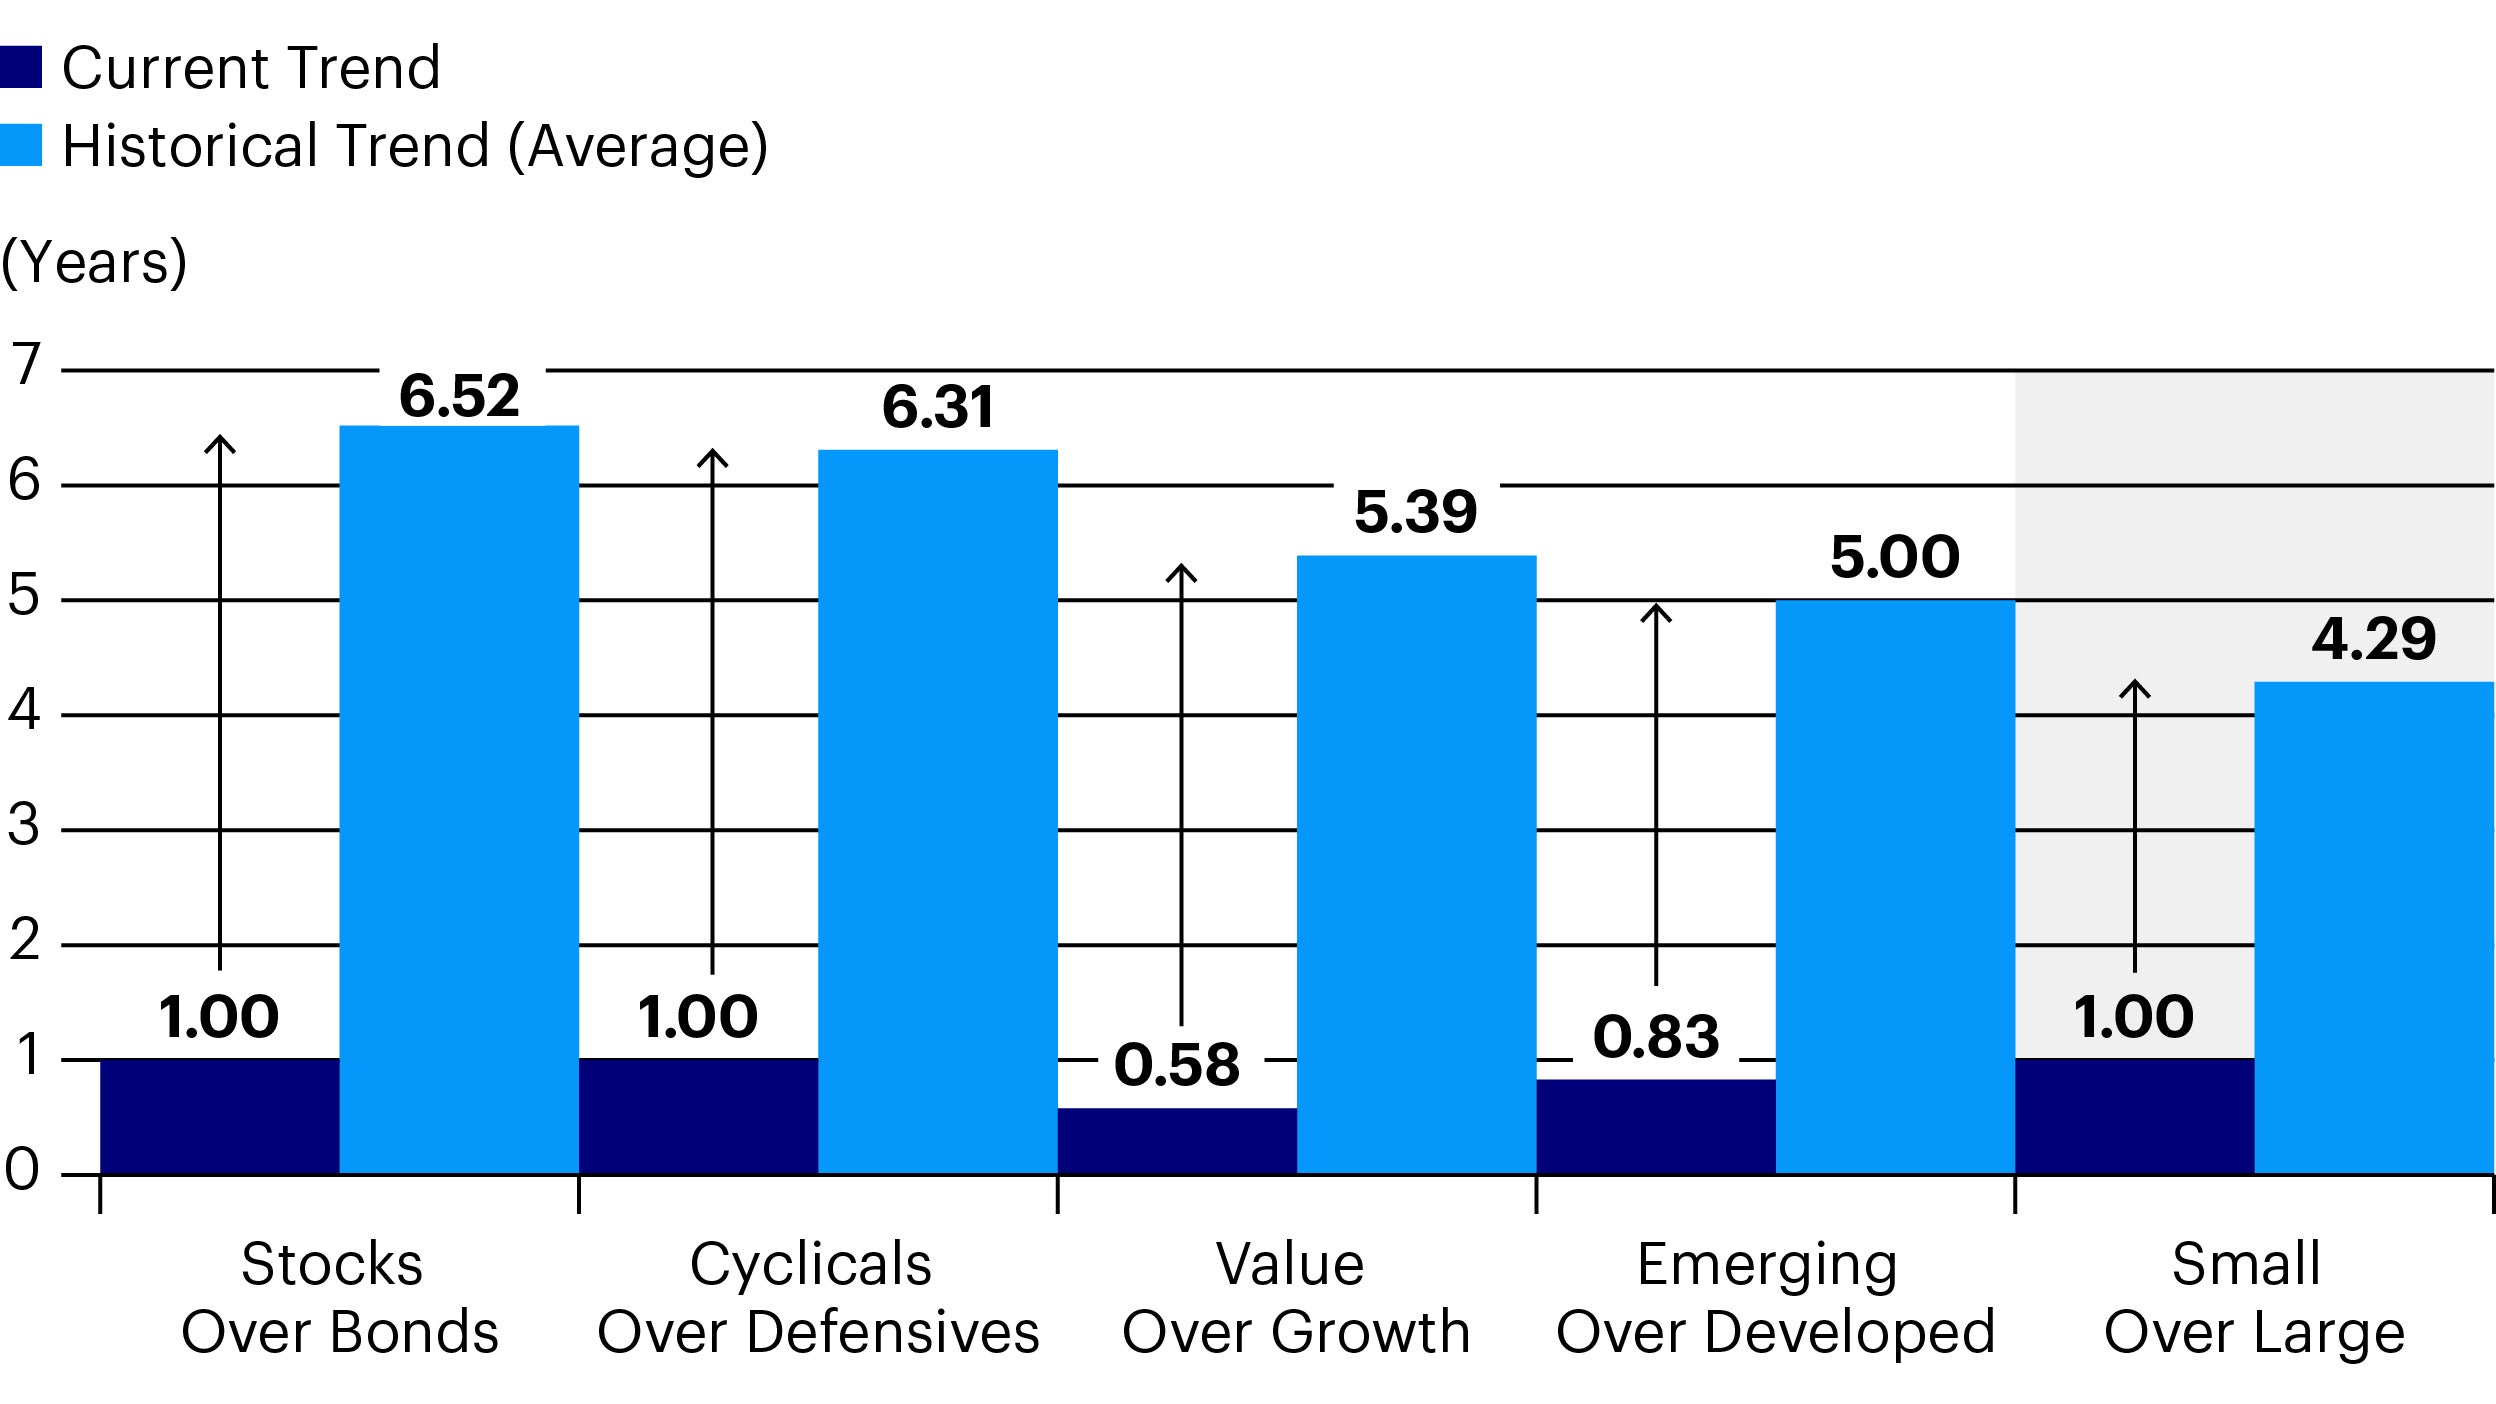
To answer that question, I looked at the average length of the “risk-on” trade across asset, sector, size, style and regional allocations since the 1980s. Specifically, I measured the number of years “risk” assets (e.g., stocks, cyclical sectors, small caps, value stocks and emerging markets) outperformed their “defensive” counterparts (e.g., bonds, counter-cyclical sectors, large caps, growth stocks and developed markets) from the lows near the last four economic recessions to the highs for each business cycle.
Encouragingly, I found that the “risk-on” trade in its many forms lasted between 4 years – in the case of small over large caps – and a whopping 7 years – in the case of stocks over bonds (Figure 2)!

For those investors who are considering pulling the plug on “risk” assets in general and small caps in particular, the message is simple. History suggests it’s far too soon for the “risk-on” trade to end. Indeed, these market trends should be considered in terms of years, not months. If past is prologue, I think small caps should have plenty of time to keep working.
Are small caps more or less inflation sensitive?
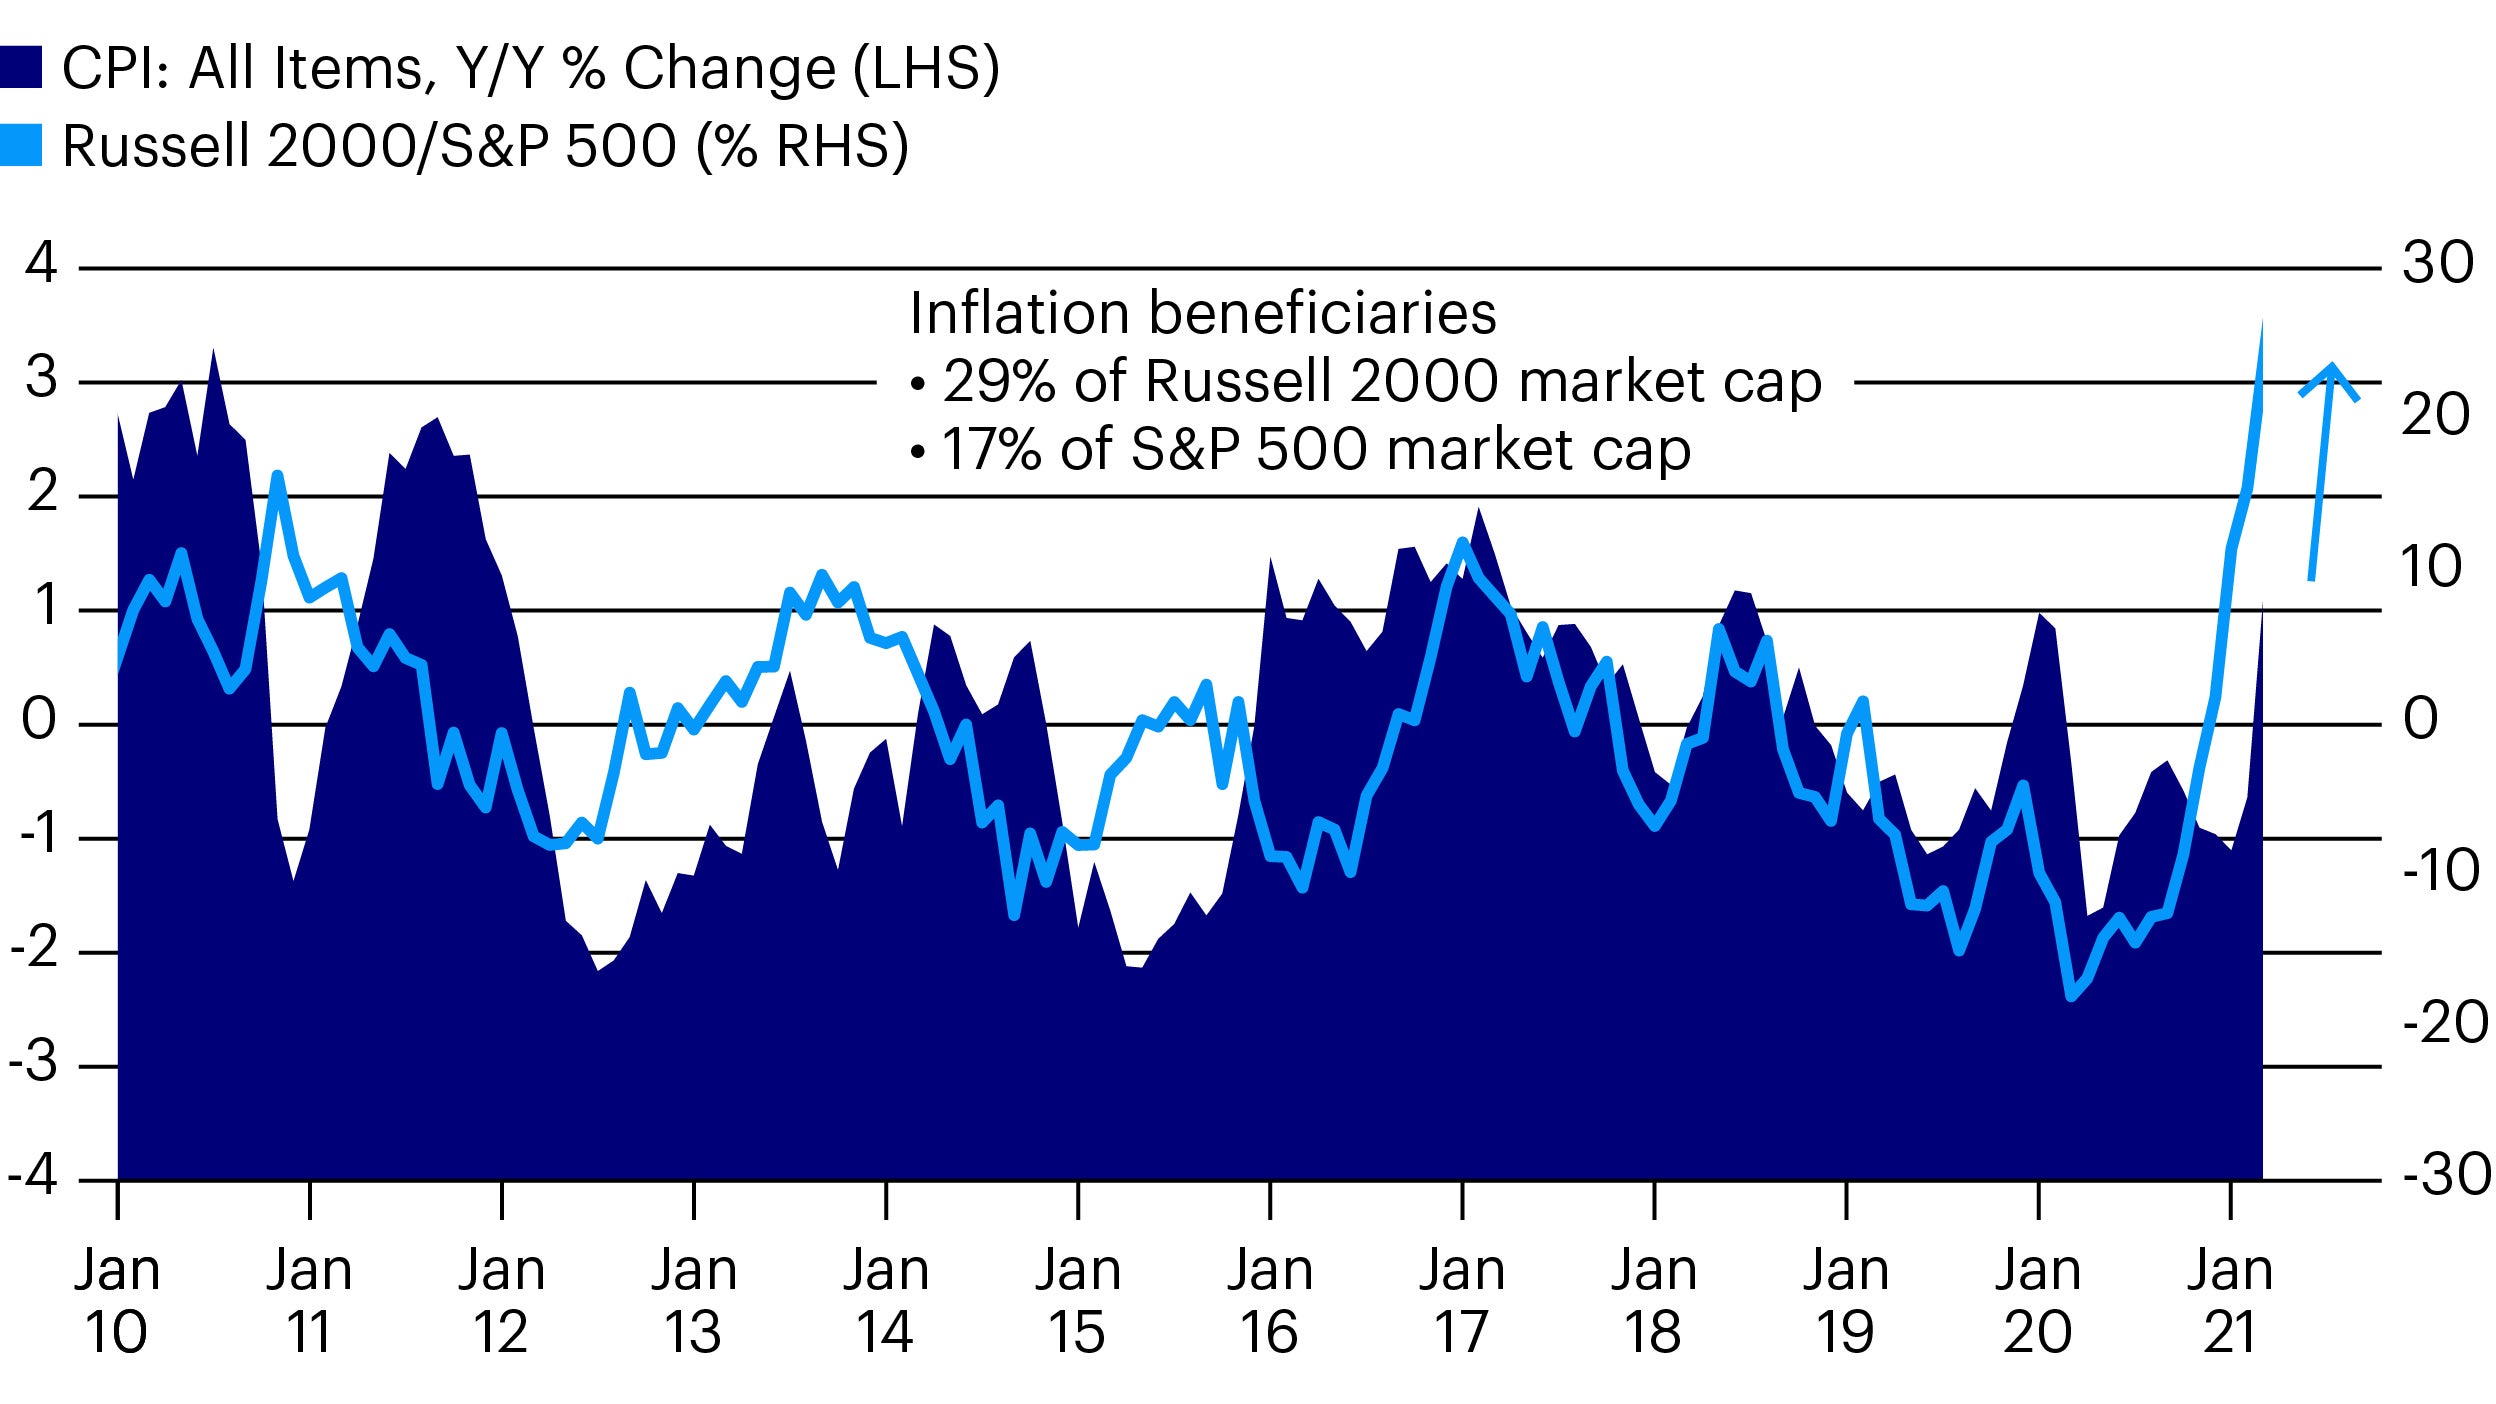
Conventional wisdom holds that larger companies have more bargaining power and can use their clout to command better pricing. While it may seem paradoxical, small caps generally outperformed their larger competitors when inflation was accelerating, as has recently been the case (Figure 3).

Why? The sector composition of the small- and large-cap benchmarks holds the key, namely their respective shares of the so-called “inflation beneficiaries.” While energy, industrials, materials and real estate capture 17% of the market cap of the S&P 500, the same collective represents a monstrous 29% of the Russell 2000!
Whether it’s because they have higher gearing to nominal economic activity, there’s simply more time on the clock or it’s the right stage of the business cycle, I think small caps should continue doing well for some time to come.
Related articles


Keep up-to-date
Sign up to receive the latest insights from Invesco’s global team of experts and details about on demand and upcoming online events.

