Invesco Bond Income Plus Limited: Half one 2021 high yield review
- Favourable economic backdrop for high yield bond markets continued
- High yield bond markets deliver positive returns in first half of 2021
- Inflation concerns unsettled government and investment grade bond markets
- Yields fall back slightly but compare favourably with government and investment grade bond markets
Market background
2021 continues to be a solid year for high yield bond markets. This is reflected by the ICE BofA European Currency High Yield Index* delivering 3.33% in sterling terms to the end of June, with a positive return in each calendar month.
*This index comprises approximately 870 individual high yield rated bonds issued in euros and sterling.
An encouraging economic outlook, combined with the prospect of ongoing central bank support, has contributed to the steady performance. Indeed, this backdrop has led some commentators to revive the ‘goldilocks’ analogy for risk markets amid optimism that benign conditions might remain ‘just right’ for potential positive returns.
Despite the relative calm, markets have continued to see periods of volatility. Much of this has been caused by fears of a significant and protracted increase in inflation triggered by stimulus programmes launched in response to the Covid-19 pandemic. Fears of further lockdowns and the possibility of central banks removing support or raising interest rates have also weighed on markets.
Higher quality bonds tend to be the most sensitive to potential changes in interest rates and so it proved as, according to ICE, Sterling investment grade corporate bonds returned -2.80% and UK Gilts -5.82% for the six-month period.
High yield markets did see a significant dispersion of returns with lower rated, and typically higher yielding, bonds significantly outperforming. ICE data showed that BB-rated bonds returned 2.52%, B-rated 4.0% and CCC & Lower returned 9.84% (all returns in sterling terms).
| % Return | Yield to Maturity % | Spread % | ||||
|---|---|---|---|---|---|---|
| Index | YTD 2021 | 2020 | 30/06/2021 | 31/12/2020 | 30/06/2021 | 31/12/2020 |
| ICE BoA European Ccy HY Index (hedged to GBP) | 3.33 | 3.16 | 3.04 | 3.34 | 3.04 | 3.65 |
| ICE BoA European Ccy HY Index (hedged to GBP) BB | 2.52 | 3.43 | 2.30 | 2.41 | 2.34 | 2.69 |
| ICE BoA European Ccy HY Index (hedged to GBP) B | 4.00 | 0.55 | 4.17 | 4.55 | 4.17 | 4.84 |
| ICE BoA European Ccy HY Index (hedged to GBP) CCC & lower | 9.84 | 8.44 | 7.61 | 9.26 | 719 | 985 |
| ICE BoAML UK Gilts Index | -5.82 | 8.84 | 0.78 | 0.33 | - | - |
| ICE BoAML Sterling Corporate Index | -2.80 | 9.30 | 9.30 | 1.44 | 106 | 113 |
Source: Bloomberg, ICE. Data to 30 June 2021.
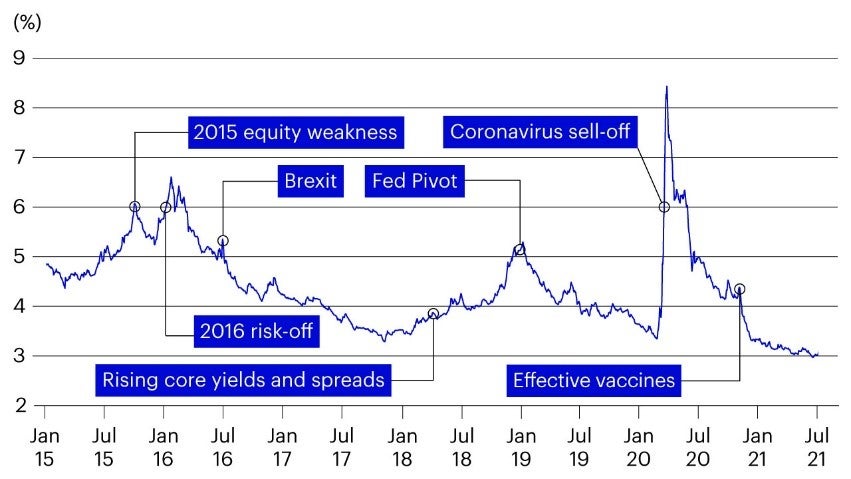
The yield on the ICE BofA European Currency High Yield Index fell from 3.34% to 3.04% over the first half of the year and experienced an all-time low of 2.96% in early June. Spreads, the additional yield achieved when compared to government bonds, continued to narrow and fell from 3.65% to 3.04%. Although spreads in the high yield space have tightened, they still provide a strong premium over investment grade bonds which is shown by the spread on the ICE BofA Sterling Investment Grade Corporate Index falling from 1.13% to 1.06%.

As yields now return to pre-COVID-19 levels, the demand for income generating assets remains high. This has led to record levels of high yield issuance as companies seek to build up cash surpluses, repair their balance sheets, or simply re-finance at a significantly lower cost. According to data from J.P.Morgan, European high yield issuance over the past six months was €93.1bn – already closing in on the record-breaking €103.3bn which was issued in the whole of 2020.
Figure 3
High yield supply
2010 |
2011 |
2012 |
2013 |
2014 |
2015 |
2016 |
2017 |
2018 |
2019 |
2020 |
YTD 2021 |
|
|---|---|---|---|---|---|---|---|---|---|---|---|---|
| Issuance €bn | 46.0 |
37.4 |
37.4 |
75.7 |
83.7 |
75.9 |
59.5 |
101.2 |
65.2 |
87.0 |
103.3 |
93.1 |
| Redemptions €bn | 18.6 |
13.0 |
15.6 |
26.6 |
45.3 |
48.6 |
57.8 |
81.6 |
49.7 |
69.6 |
45.3 |
36.4 |
| Net €bn | 27.4 |
24.4 |
21.8 |
49.1 |
38.4 |
27.3 |
1.7 |
19.6 |
15.5 |
17.4 |
58.0 |
56.7 |
| # of bonds issued | 115 |
107 |
110 |
216 |
219 |
176 |
145 |
233 |
163 |
182 |
206 |
188 |
Source: Bloomberg, ICE. Data to 30 June 2021.
Now most companies can access finance, and the global economy continues its recovery, default rates have fallen. According to Moody’s, as at the end of June only 28 issuers have defaulted year to date which is less than a quarter of the 114 defaults in the same period last year. Moody’s go on to forecast that their baseline trailing 12-month default rate will fall from the current 3.9% to 2.2% in June 2022.
Market outlook
Although yields are currently quite low and valuations are quite stretched in many cases, there are three reasons which suggests the backdrop for high yield bond markets is broadly positive.
- Fiscal and monetary policy remains supportive
- The improving trajectory of economies post-covid gives cause for optimism.
- Defaults are low and forecast to drop further.
From my perspective, given the low level of yields, some increase in volatility would be welcome as the portfolio is well-positioned for such a backdrop.
Finally, inflation is an important risk factor to monitor. I’ve responded to that by keeping interest rate sensitivity low in the portfolio and being very disciplined in sticking to the types of higher yielding bonds that the trust normally holds.


