The high yield default environment in 2020

Forecast and realised defaults
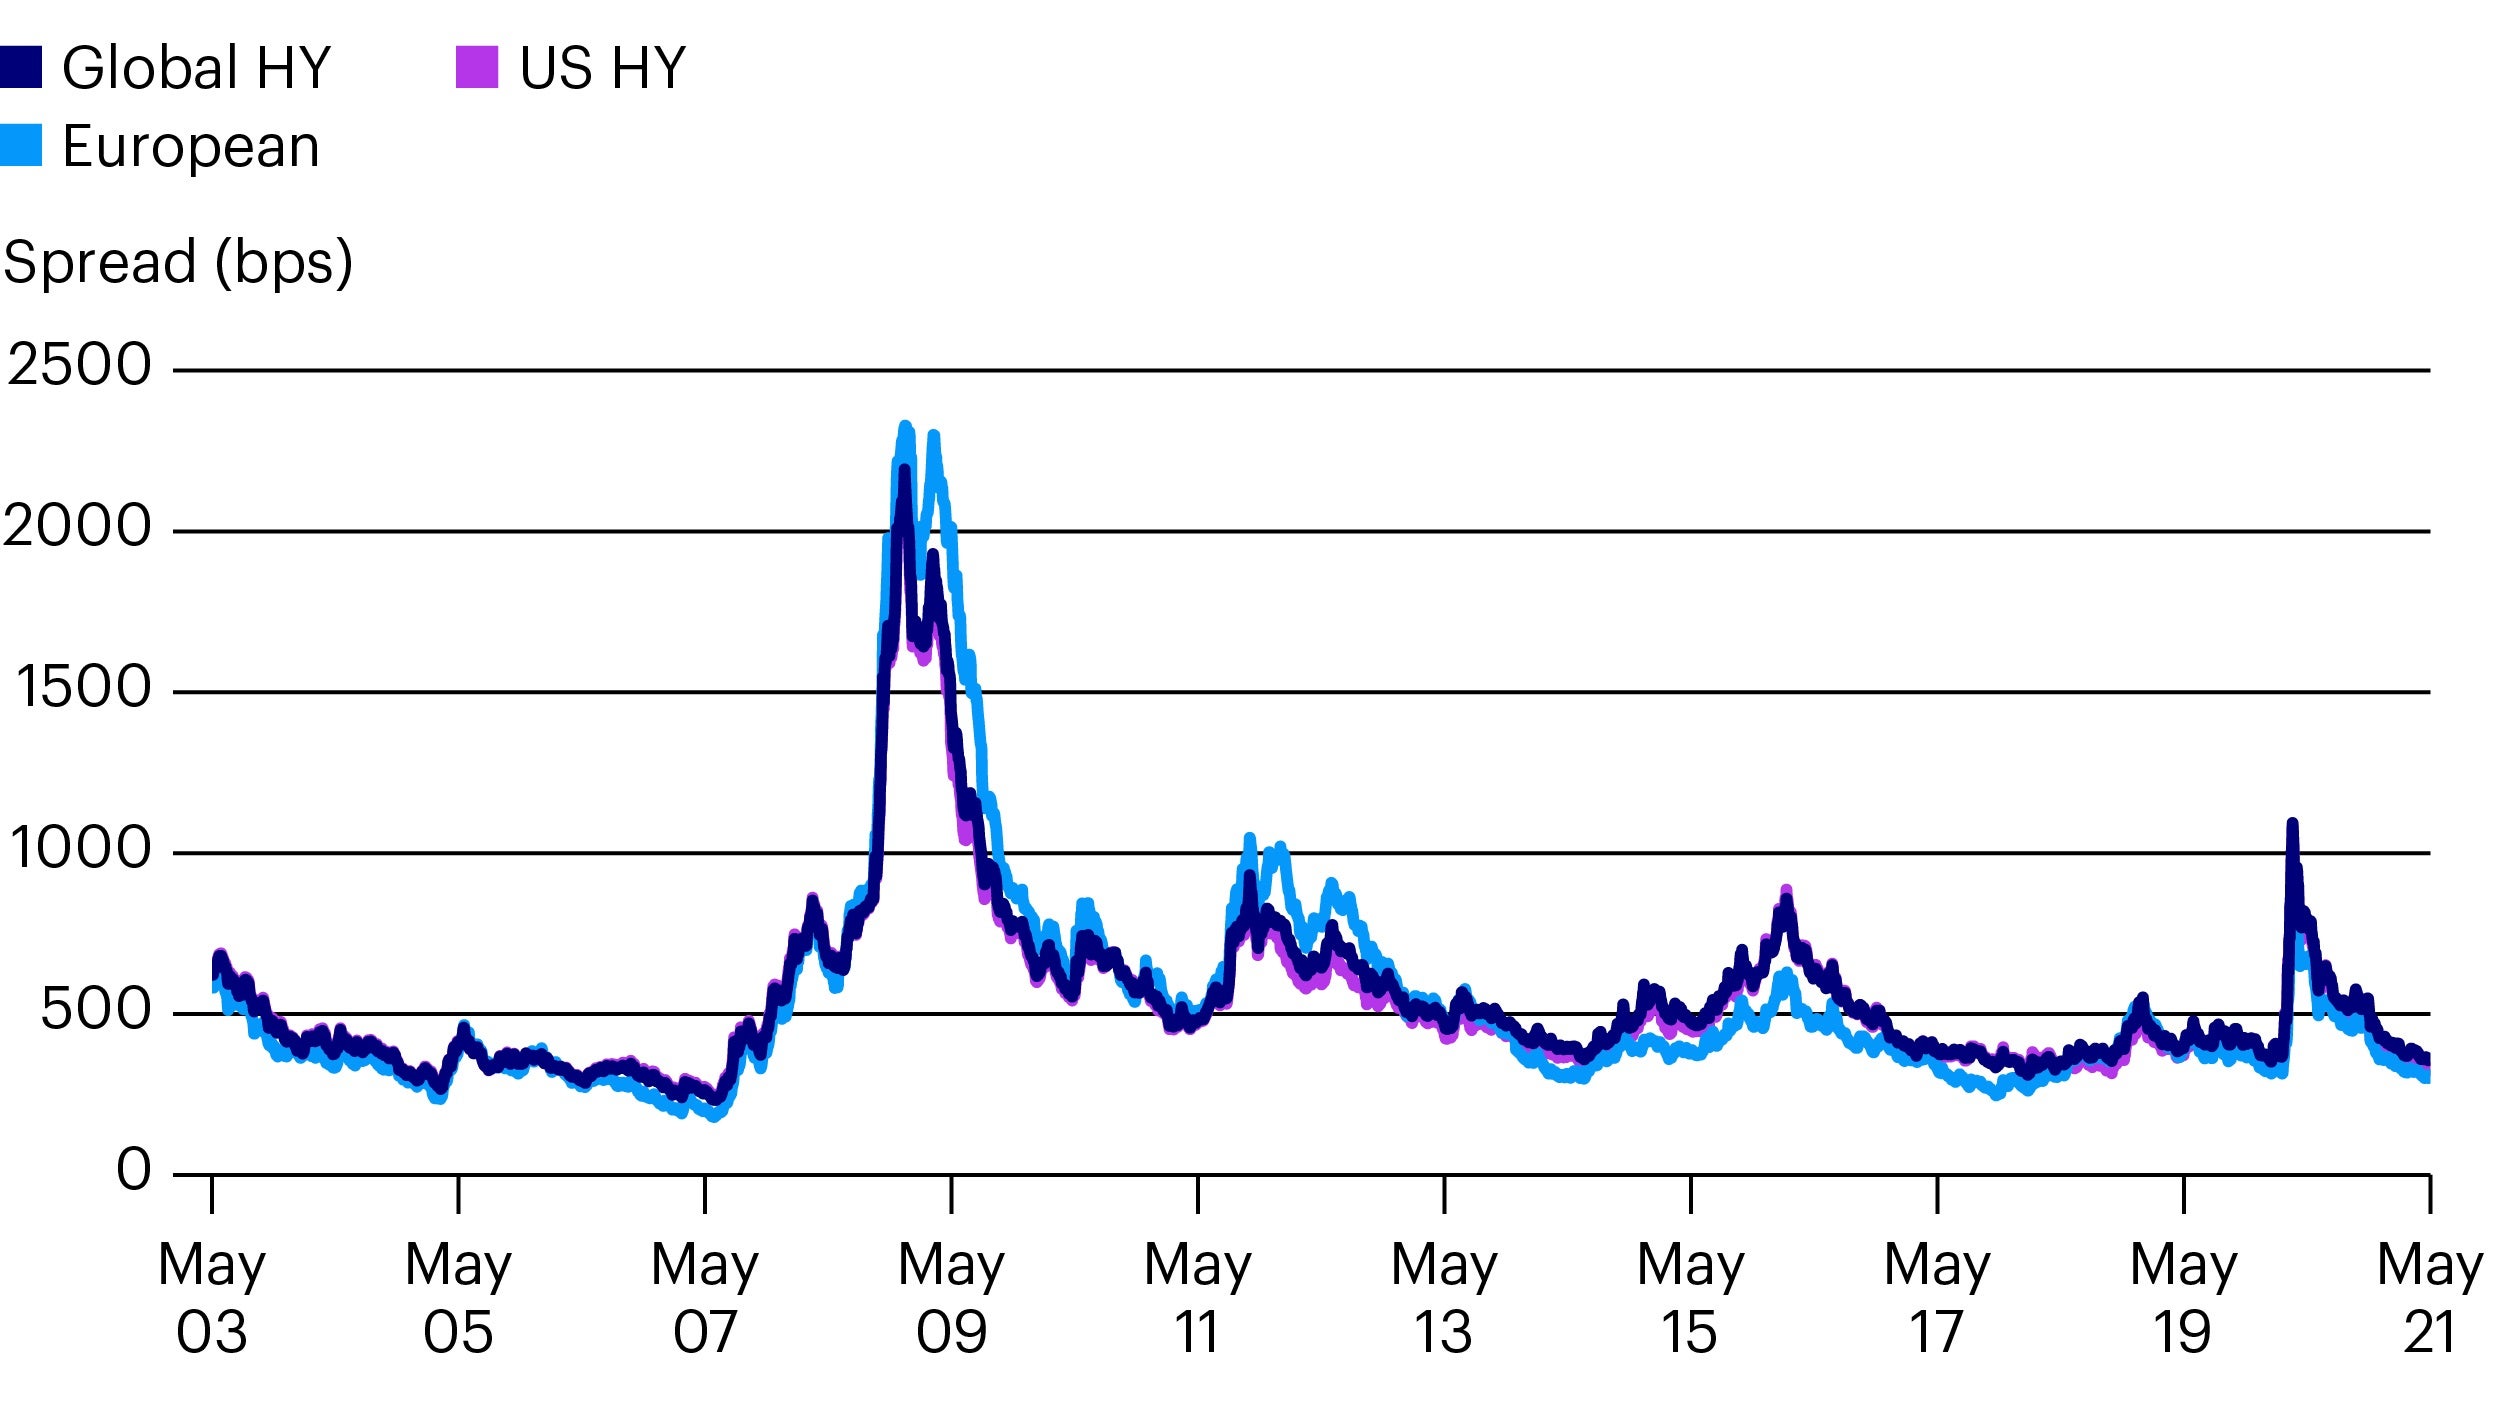
In March 2020, the coronavirus-induced economic downturn and the oil price collapse combined to create the sharpest increase in high yield spreads1 in over a decade. In turn, this led to a substantial rise in defaults. However, the anticipated surge in defaults never materialised, because of the actions taken by governments and central banks around the world to assist companies.

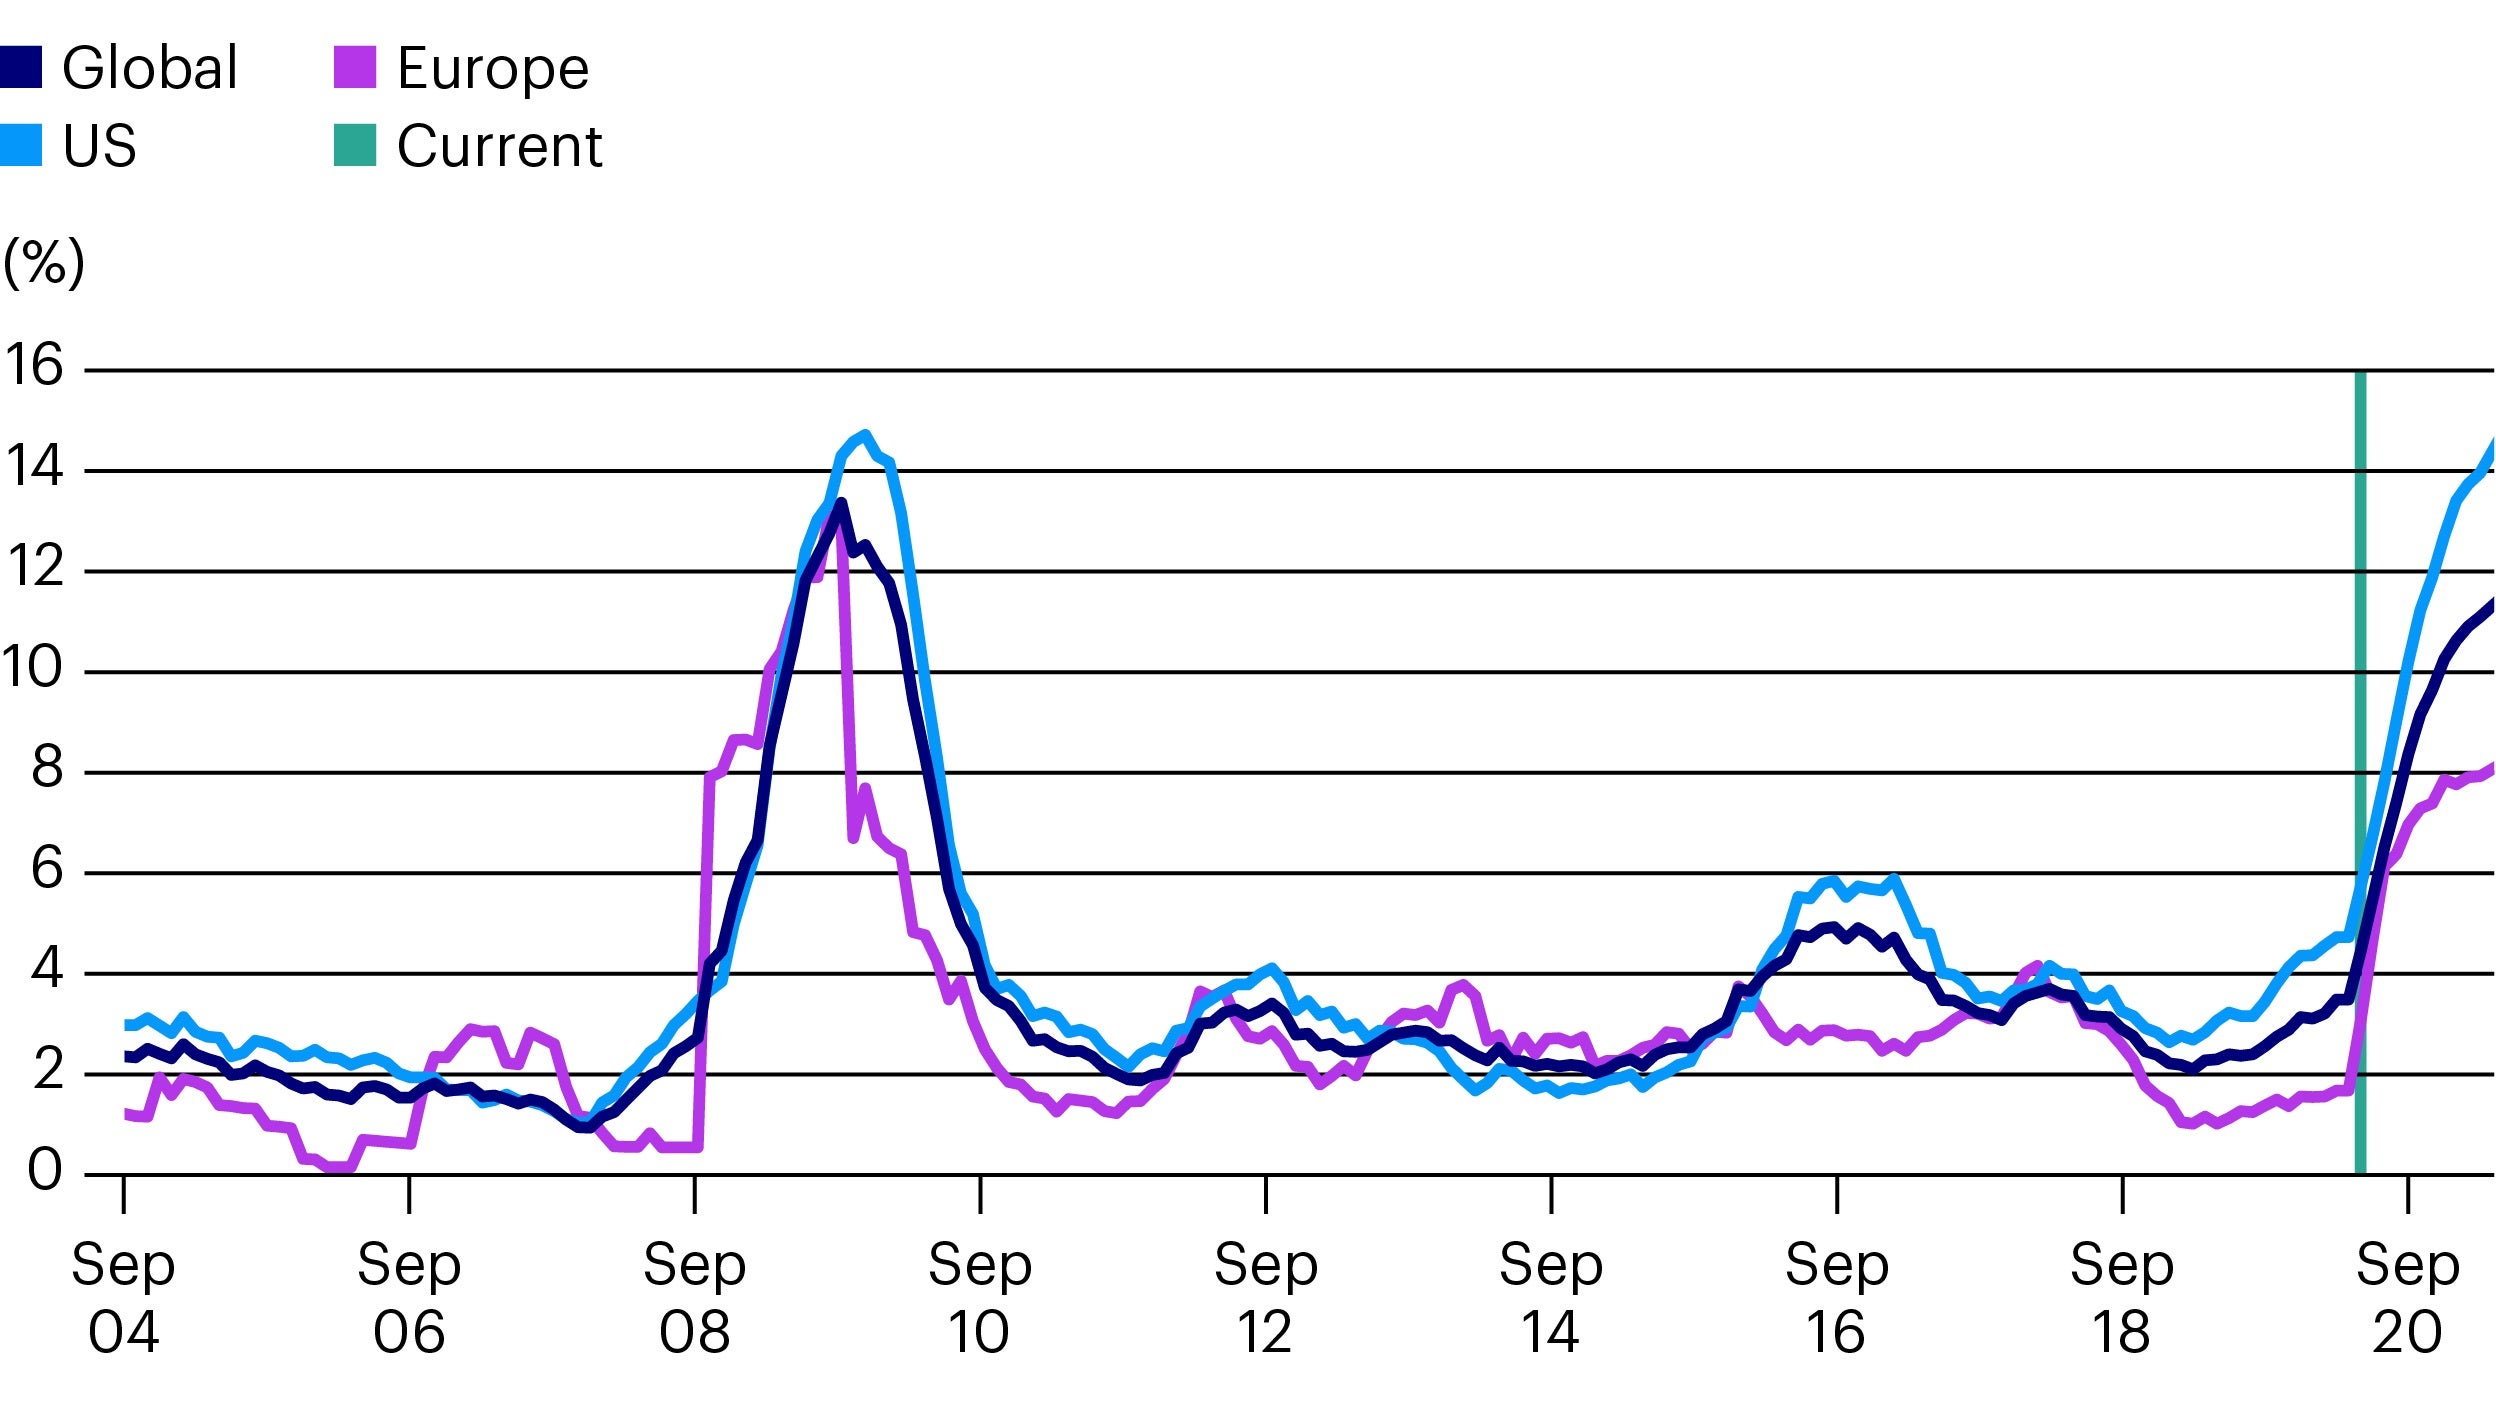
The Moody’s Monthly Default Report published in April 2020 predicted that the Global high yield default rate would peak at 11.3% in March 2021. This was based on their ‘baseline’ forecast which assumed high yield spreads would rise to 1261bps in June 2020. Their ‘pessimistic’ forecast had spreads peaking at 1755bps in September and a default rate of 16.3% in March 2021.

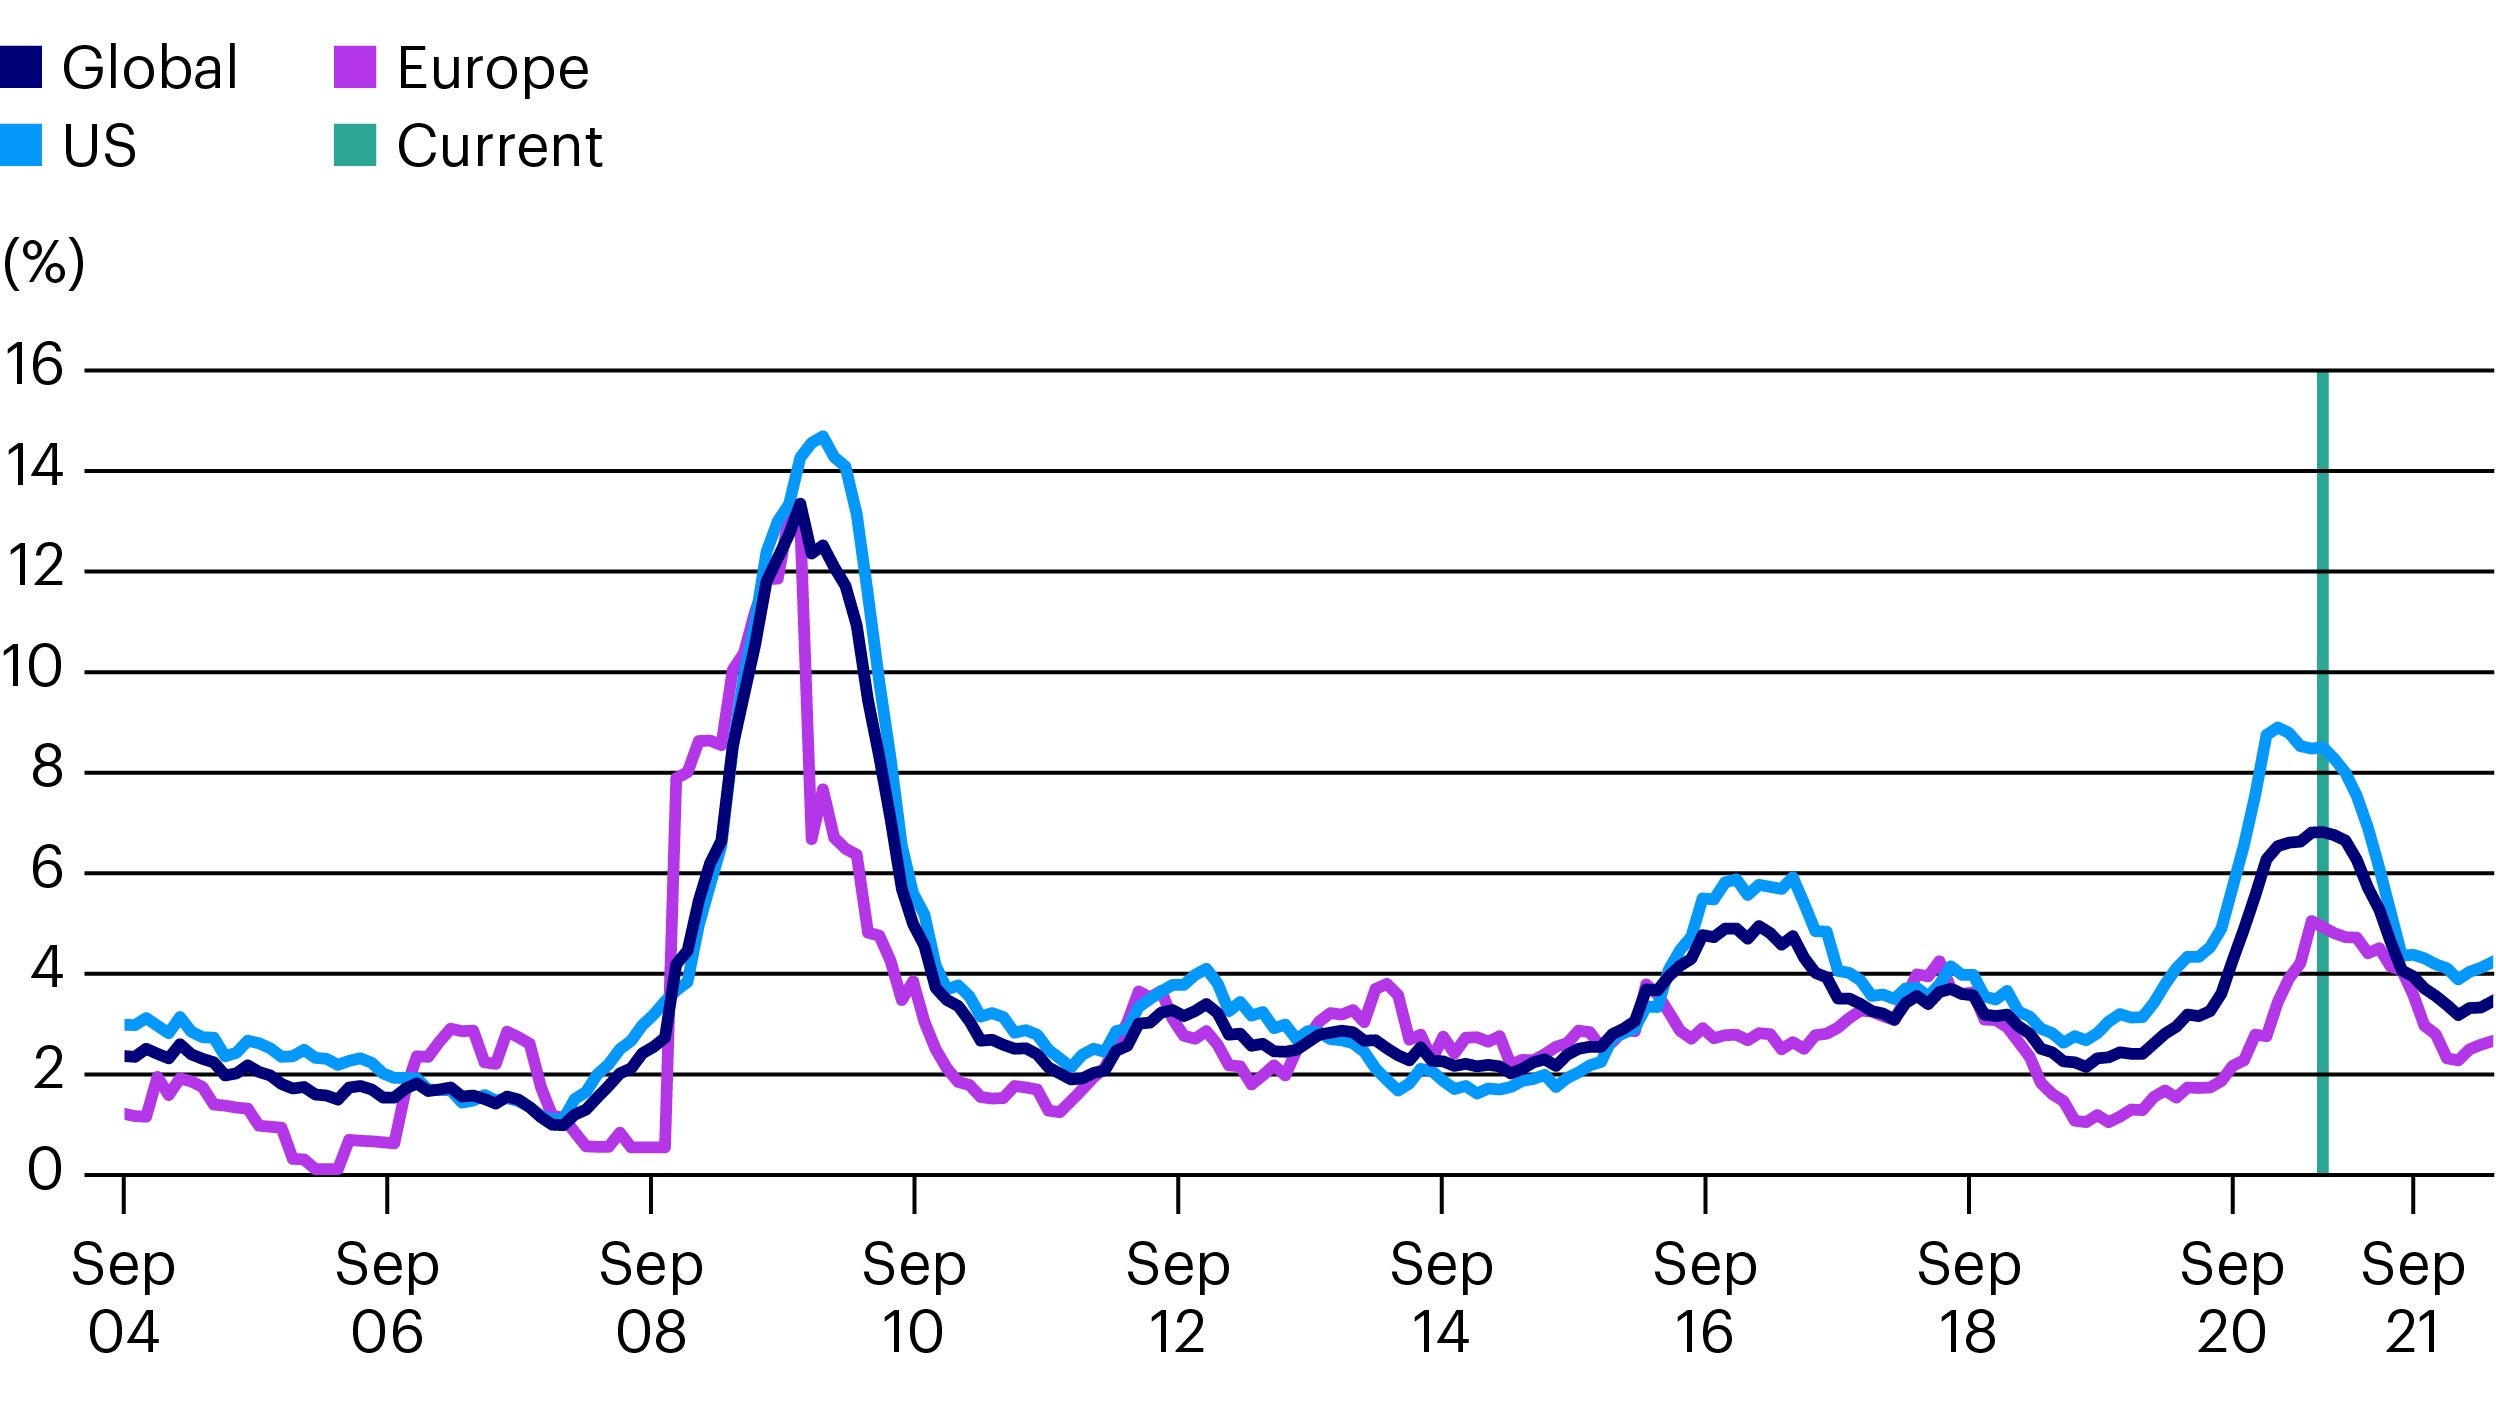
However, with eyewatering levels of monetary and fiscal support, those forecasts have proven to be wide of the mark. Since that report was published, markets have continued to function and remained open to all but the most troubled issuers. Spreads ultimately peaked at much lower levels and a year on, the actual level of defaults for March 2021 was 6.3%, significantly lower than the 11.3% initially forecast. This is still some way ahead of the long-term average of 4.2%2, but the rate is forecast to continue falling to 3.2% by the end of 2021.

2020 defaults
Moody’s also publish each January a more detailed ‘Annual Default Study’ which includes a full list of defaults for the prior year. In this they state that the 12-month global default rate was 6.7% at the end of 2020, up from 3.2% at the end of 2019. In numerical terms, 211 corporate issuers defaulted, up from 105 the previous year and the highest since 2009.
Of the 211 issuers defaulting, 141 were North American, 38 European. The rest were Asia (17), Latin America (13) and Middle East & Africa (2). A significant driver of the difference between US and European defaults is the prominence of different sectors, particularly the impact of the Energy sector which is 13.5% of the US index and only 4.7% of the European one. Moody’s report that the Oil & Gas sector was the largest contributor to defaults in 2020, with 52 casualties. Business Services saw 27 defaults and Retail saw 24.
Distressed exchanges were the most prominent type of default accounting for 46% in 2020. A distressed exchange occurs when a company’s creditors agree to restructure its debt, allowing it to survive as a business but with a less onerous debt burden. The remainder were evenly split between payment defaults and bankruptcies.
Portfolio defaults
Providing a portfolio level percentage default rate is a subjective exercise, and something we tend to not to do. To understand why, it is important to consider that prior to a bond defaulting there is typically a period when it trades significantly down in price. Indeed, Invesco Bond Income Plus Limited will occasionally purchase such bonds as ‘distressed’ investments. This time-lag creates an issue in terms of reporting defaults because a distressed bond can be sold before it defaults and no default reported, yet the portfolio may still have suffered a loss. In fact, the best course of action at that point may have been to continue to hold the bond, to ‘follow it’ through a default and balance sheet restructuring.
It is also important to identify what a default is, and the impact. A default could be a as mild as a late coupon payment, and ultimately no loss might occur. At the other end of the scale, a company could undergo fraudulent activity and its bonds could become almost worthless. Between these lie distressed exchanges. Another factor is where in the queue you stand, senior bondholders can often see meaningful recovery, while holders of junior or subordinated debt may fare worse.
Nonetheless, I appreciate that this could be viewed as an attempt to avoid the question.
Comparing the trust portfolio against the Moody’s default list for 2020, there are six positions that Moody’s identify as having defaulted. I asked our performance team to check their impact on the portfolio for the calendar year 2020. As the figures show, a default does not always result in a loss, because a defaulted bond that was purchased at a large discount can prove to be a very profitable investment. Last year’s rise in defaults presented three such opportunities: Codere, Hema and Petra Diamonds.
The six holdings, and the contribution of each to the trust’s performance were: Codere (+28bps), Europcar (-13bps), Hema (+48bps), Hertz (-6bps), JC Penny (-47bps) and Petra Diamonds (-18bps).
Conversely, the challenges of reporting of defaults is highlighted by the worst performing position in the portfolio in 2020 – Matalan, a holding that Moody’s did not list as a default. The senior Matalan bonds held in the portfolio were priced around 100 and the subordinated bonds at 50 (as at 31 March 2021) and cost the portfolio -57bps in 2020.
I would summarise as saying that distressed bonds, that are likely to default, can sometimes represent a source of opportunity for us. Whilst this is not a core area of investing for the trust, it is an area in which the Invesco team has significant expertise in both assessing and managing investments that have become distressed, as well as identifying investment opportunities for the portfolio.
Unfortunately, it also adds to the challenges around reporting defaults within the portfolio because some distressed bonds will have been purchased with a view to a restructuring. Petra Diamonds is a very good example of this. This is a position I already had some exposure to at the start of 2020. As it became apparent that a default was likely, I chose to increase that exposure, but at a ‘distressed price’ in the mid-30s.
Our view was that the company should survive but would require a balance sheet restructuring. Purchasing bonds at a distressed price of 30 offered significant upside because we were prepared to follow through with the restructuring, even if it did mean recording a default. March 2021 saw the company successfully restructured and bondholders received new bonds as well as taking ownership of most of the existing equity. Our performance team report a healthy gain of 72bps for the portfolio in Q1 2021 from Petra Diamonds.
I will endeavour to provide a similar, granular update on portfolio defaults on an annual basis.
Note: Invesco Bond Income Plus Limited was previously City Merchants High Yield Trust Limited.


