Product Details
The Invesco S&P 500 Value with Momentum ETF (Fund) is based on the S&P 500 High Momentum Value Index (Index). The Fund will invest at least 90% of its total assets in the component securities that comprise the Index. The Index is comprised of 100 securities in the S&P 500® Index having the highest “value scores” and “momentum scores,” calculated pursuant to the index methodology. Underlying Index constituents are weighted by their value scores; securities with higher value scores receive relatively greater weights. The Fund and the Index are rebalanced and reconstituted semi-annually.
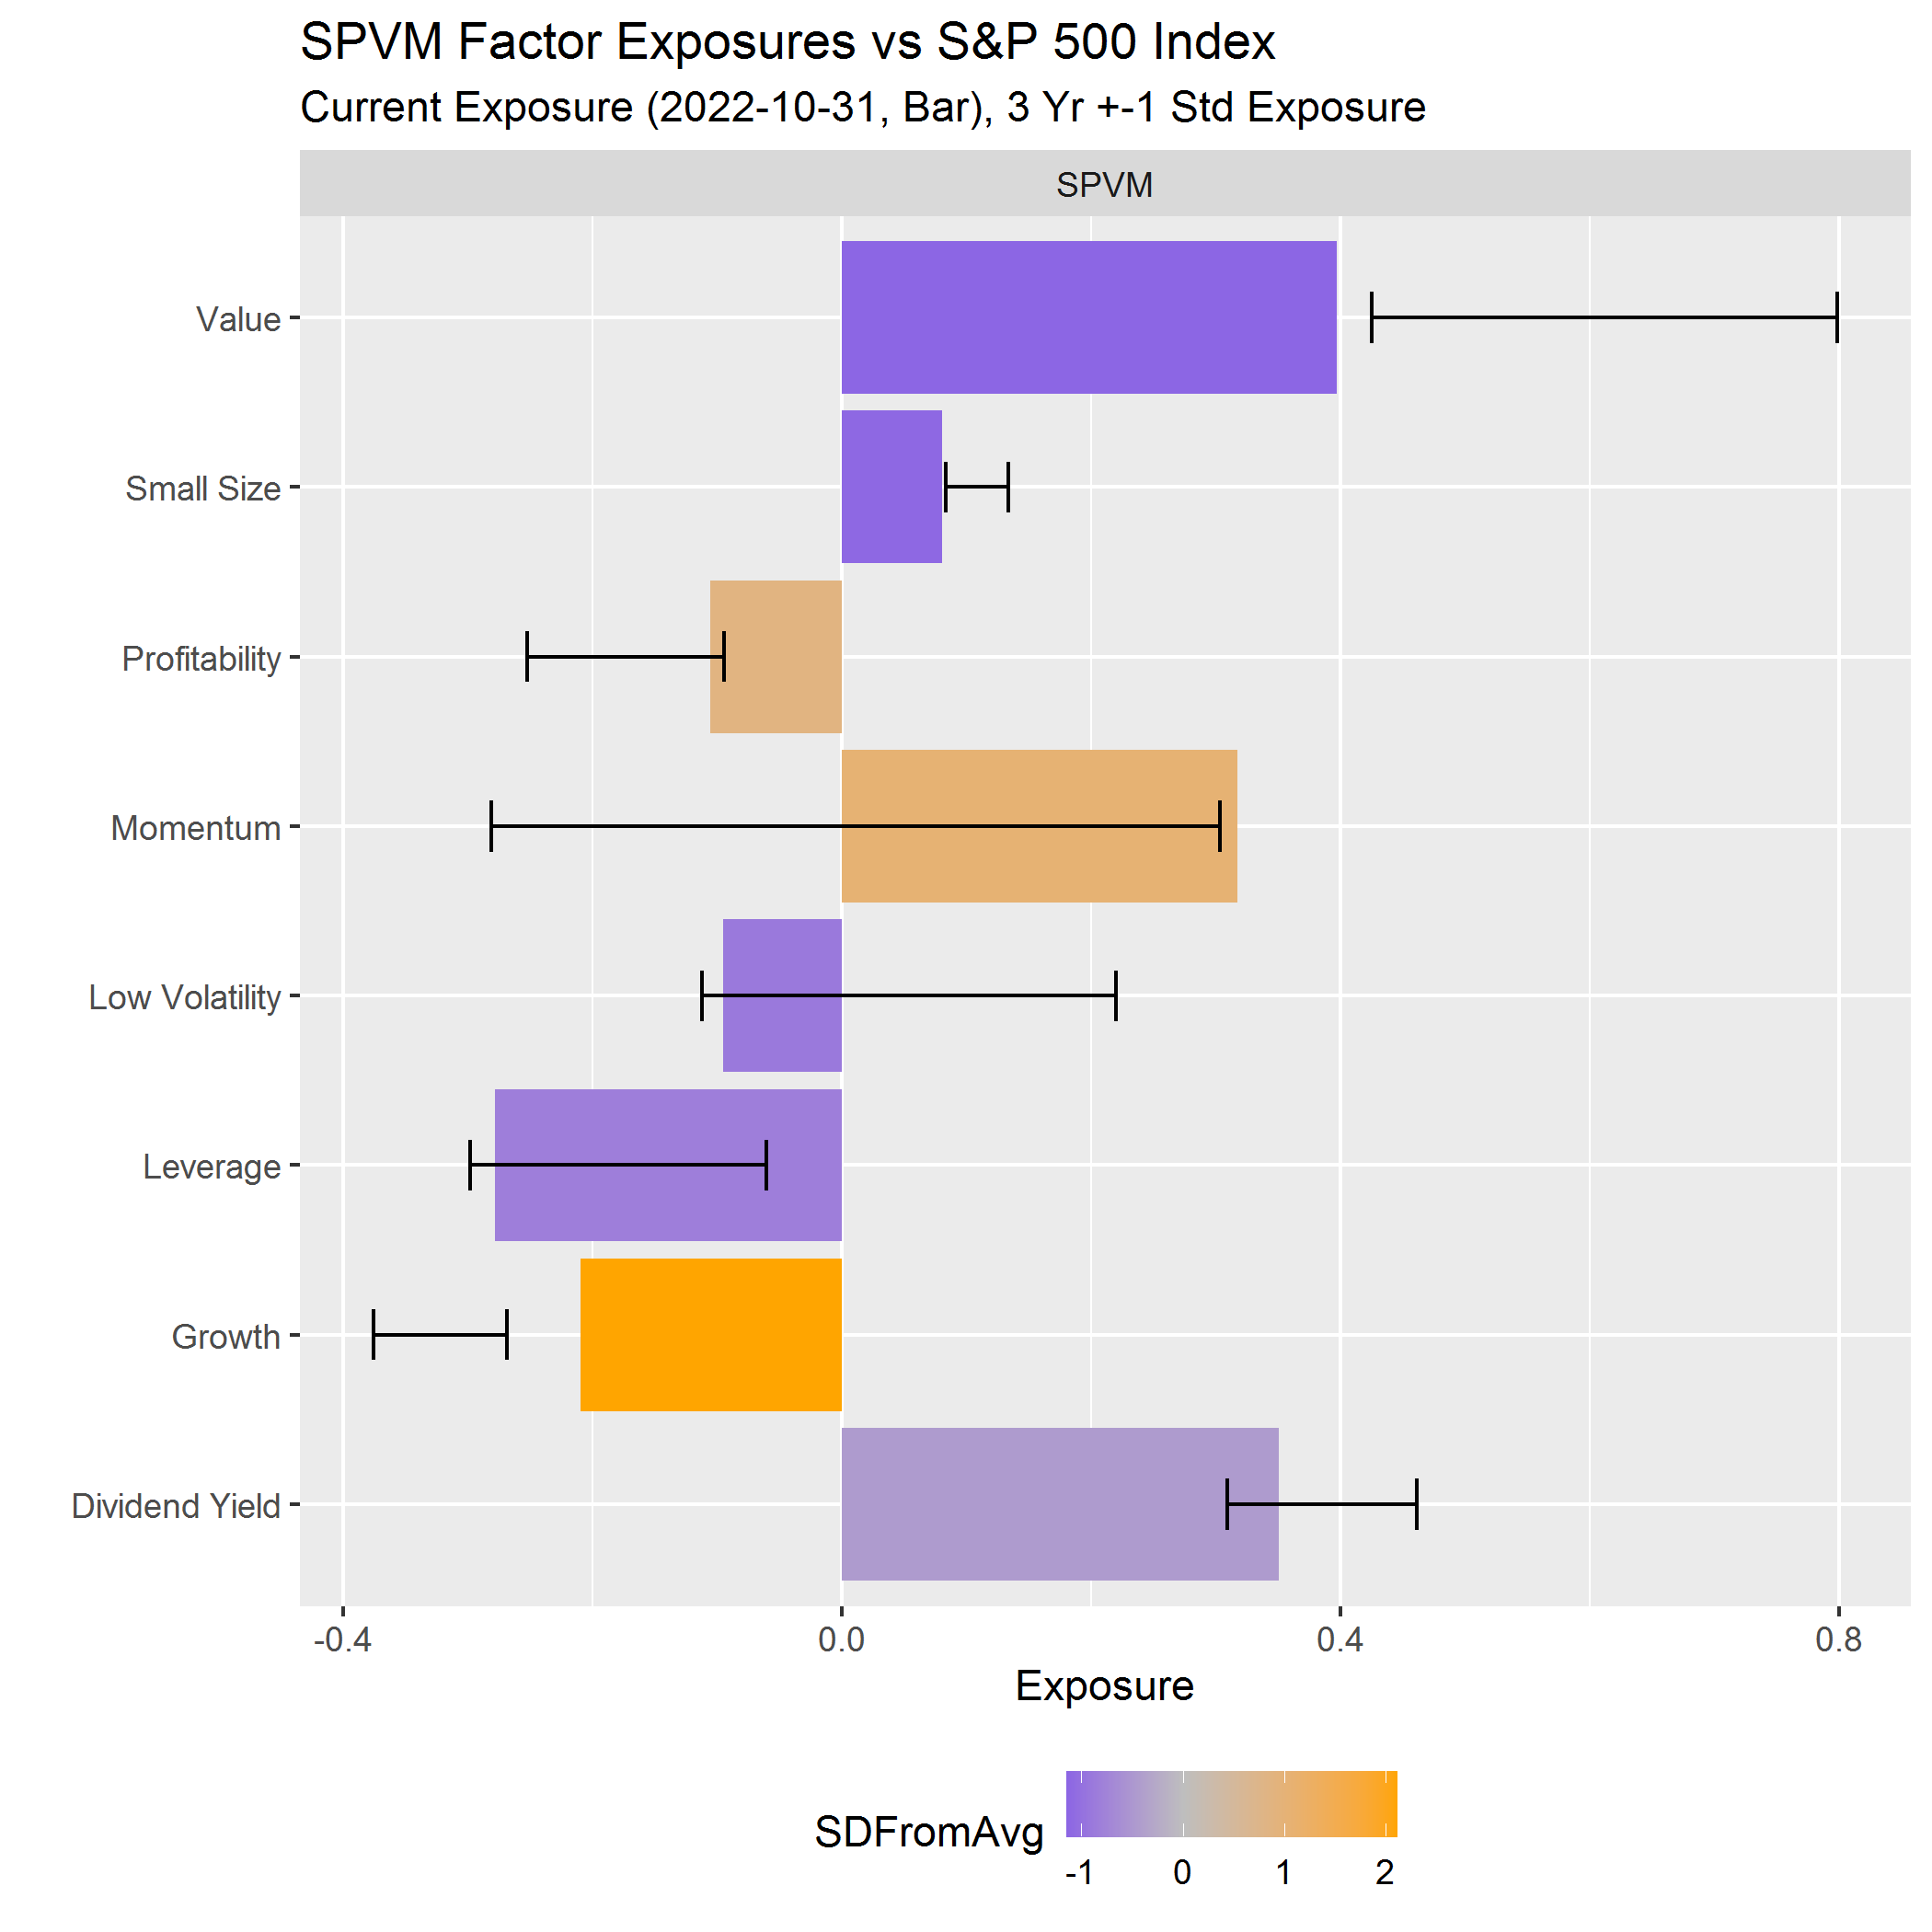
Factor DNATM
Financial Professionals - Log in to view the fund’s Factor DNATM chart
Source: Axioma, Inc.
Factor score methodology
Axioma is used to calculate the data that goes into the charts. We use Axioma's global short time horizon risk model.
The current factor exposures of the ETF relative to its benchmark index are shown using the bars in the chart. Each factor's band indicates the +/- one standard deviation exposure of the fund to that factor over the past three years.
The bar color is determined by comparing the number of standard deviations the current exposure is from the average three-year exposure. Higher exposures are a bright color, while lower exposures are a dark color.
See notes below for factor definitions.
Value: Book to price; Small size: Natural log of the total issuer market capitalization average over the last month. Companies with a smaller market cap receive a higher score; Profitability: considers return-on-equity, return-on-assets, cash-flow-to-assets, cash-flow-to-income, gross margin and sales-to-assets; Momentum: cumulative return over last 20 days; Low Volatility: square root of 60-day average of absolute return / cross sectional market volatility. Lower volatility stocks receive a higher score; Leverage: equal weight average of debt-to-assets and debt-to-equity; Growth: equal weight average of earnings growth rate and the sales growth rate; Dividend Yield: trailing 12-month dividend yield.
Performance
| Index History (%) | YTD | 1Yr | 3Yr | 5Yr | 10Yr | Since Inception |
|---|---|---|---|---|---|---|
| S&P 500 High Momentum Value Index | 13.25 | 12.90 | 12.65 | 15.24 | N/A | N/A |
| S&P 500 Index | 10.79 | 15.88 | 19.54 | 14.74 | 14.60 | 14.27 |
| Fund History (%) | ||||||
| Fund NAV | 13.16 | 12.67 | 12.28 | 14.83 | 11.16 | 11.23 |
| After Tax Held | 12.69 | 11.91 | 11.60 | 14.22 | 10.51 | 10.61 |
| After Tax Sold | 7.76 | 7.62 | 9.42 | 11.79 | 9.04 | 9.34 |
| Fund Market Price | 13.19 | 12.72 | 12.27 | 14.81 | 11.17 | 11.25 |
| Index History (%) | YTD | 1Yr | 3Yr | 5Yr | 10Yr | Since Inception |
|---|---|---|---|---|---|---|
| S&P 500 High Momentum Value Index | 5.10 | 12.98 | 11.96 | 15.41 | N/A | N/A |
| S&P 500 Index | 6.20 | 15.16 | 19.71 | 16.64 | 13.65 | 14.11 |
| Fund History (%) | ||||||
| Fund NAV | 4.89 | 12.53 | 11.52 | 14.95 | 9.63 | 10.77 |
| After Tax Held | 4.45 | 11.79 | 10.85 | 14.34 | 8.99 | 10.15 |
| After Tax Sold | 2.89 | 7.60 | 8.85 | 11.92 | 7.73 | 8.93 |
| Fund Market Price | 4.94 | 12.66 | 11.52 | 14.98 | 9.63 | 10.79 |
Market returns are based on the midpoint of the bid/ask spread at 4 p.m. ET and do not represent the returns an investor would receive if shares were traded at other times. Performance data quoted represents past performance, which is not a guarantee of future results. Investment returns and principal value will fluctuate, and shares, when redeemed, may be worth more or less than their original cost. Current performance may be higher or lower than performance data quoted. After-tax returns reflect the highest federal income tax rate but exclude state and local taxes. Fund performance reflects applicable fee waivers, absent which, performance data quoted would have been lower. After Tax Held and After Tax Sold are based on NAV. Returns less than one year are cumulative.
Growth of $10,000
Data beginning Fund inception and ending 06/30/2025. Fund performance shown at NAV.
S&P 500 High Momentum Value Index performance prior to 5/22/2015 reflects that of the original Underlying Index, RAFI Fundamental Large Value Index. From 5/22/2015 to 6/21/2019, performance reflects that of the previous Underlying Index, Russell Top 200® Pure Value Index. From 6/21/2019 forward, performance reflects that of the Underlying Index, S&P 500 High Momentum Value Index AND IS NOT INTENDED FOR ANY THIRD PARTY USE.
Sector Allocation
| Sector | Percent of Fund |
|---|---|
| Financials | 36.79% |
| Utilities | 13.89% |
| Consumer Discretionary | 8.37% |
| Communication Services | 7.60% |
| Industrials | 6.94% |
| Health Care | 6.01% |
| Information Technology | 5.09% |
| Consumer Staples | 5.01% |
| Materials | 4.68% |
| Real Estate | 2.67% |
| Energy | 2.26% |
| Investment Companies | 0.70% |
as of 09/22/2025 Top Holdings | View All
Fund Holdings subject to change
| Ticker | Company | % of Fund |
|---|---|---|
| GM | General Motors Co | 2.60 |
| HPE | Hewlett Packard Enterprise Co | 2.38 |
| IVZ | Invesco Ltd | 2.14 |
| UAL | United Airlines Holdings Inc | 2.08 |
| MHK | Mohawk Industries Inc | 1.95 |
| PSKY | Paramount Skydance Corp | 1.92 |
| C | Citigroup Inc | 1.71 |
| WBD | Warner Bros Discovery Inc | 1.63 |
| PHM | PulteGroup Inc | 1.60 |
| CFG | Citizens Financial Group Inc | 1.56 |
Distributions | Hide View All
| Ex-Date | Record Date | Pay Date | $/ Share |
Ordinary Income | Short Term Gains | Long Term Gains | Return of Capital | Liquidation Distribution |
|---|---|---|---|---|---|---|---|---|
| 09/22/2025 | 09/22/2025 | 09/26/2025 | 0.45666 | 0.45666 | - | - | - | - |
| 06/23/2025 | 06/23/2025 | 06/27/2025 | 0.26218 | 0.26218 | - | - | - | - |
| 03/24/2025 | 03/24/2025 | 03/28/2025 | 0.33476 | 0.33476 | - | - | - | - |
| 12/23/2024 | 12/23/2024 | 12/27/2024 | 0.32833 | 0.32833 | - | - | - | - |
| 09/23/2024 | 09/23/2024 | 09/27/2024 | 0.28510 | 0.28510 | - | - | - | - |
| 06/24/2024 | 06/24/2024 | 06/28/2024 | 0.21524 | 0.21524 | - | - | - | - |
| 03/18/2024 | 03/19/2024 | 03/22/2024 | 0.27203 | 0.27203 | - | - | - | - |
| 12/18/2023 | 12/19/2023 | 12/22/2023 | 0.32403 | 0.32403 | - | - | - | - |
| 09/18/2023 | 09/19/2023 | 09/22/2023 | 0.26466 | 0.26466 | - | - | - | - |
| 06/20/2023 | 06/21/2023 | 06/23/2023 | 0.28265 | 0.28265 | - | - | - | - |
| 03/20/2023 | 03/21/2023 | 03/24/2023 | 0.37307 | 0.37307 | - | - | - | - |
| 12/19/2022 | 12/20/2022 | 12/23/2022 | 0.35133 | 0.35133 | - | - | - | - |
| 09/19/2022 | 09/20/2022 | 09/23/2022 | 0.31145 | 0.31145 | - | - | - | - |
| 06/21/2022 | 06/22/2022 | 06/30/2022 | 0.27120 | 0.27120 | - | - | - | - |
| 03/21/2022 | 03/22/2022 | 03/31/2022 | 0.21686 | 0.21686 | - | - | - | - |
| 12/20/2021 | 12/21/2021 | 12/31/2021 | 0.18673 | 0.18673 | - | - | - | - |
| 09/20/2021 | 09/21/2021 | 09/30/2021 | 0.18409 | 0.18409 | - | - | - | - |
| 06/21/2021 | 06/22/2021 | 06/30/2021 | 0.16276 | 0.16276 | - | - | - | - |
| 03/22/2021 | 03/23/2021 | 03/31/2021 | 0.19549 | 0.19549 | - | - | - | - |
| 12/21/2020 | 12/22/2020 | 12/31/2020 | 0.20241 | 0.20241 | - | - | - | - |
| 09/21/2020 | 09/22/2020 | 09/30/2020 | 0.20621 | 0.20621 | - | - | - | - |
| 06/22/2020 | 06/23/2020 | 06/30/2020 | 0.22603 | 0.22603 | - | - | - | - |
| 03/23/2020 | 03/24/2020 | 03/31/2020 | 0.22268 | 0.22268 | - | - | - | - |
| 12/23/2019 | 12/24/2019 | 12/31/2019 | 0.28148 | 0.28148 | - | - | - | - |
| 09/23/2019 | 09/24/2019 | 09/30/2019 | 0.23072 | 0.23072 | - | - | - | - |
| 06/24/2019 | 06/25/2019 | 06/28/2019 | 0.31189 | 0.31189 | - | - | - | - |
| 03/18/2019 | 03/19/2019 | 03/29/2019 | 0.21218 | 0.21218 | - | - | - | - |
| 12/24/2018 | 12/26/2018 | 12/31/2018 | 0.27717 | 0.27717 | - | - | - | - |
| 09/24/2018 | 09/25/2018 | 09/28/2018 | 0.28905 | 0.28905 | - | - | - | - |
| 06/18/2018 | 06/19/2018 | 06/29/2018 | 0.32536 | 0.32536 | - | - | - | - |
| 03/19/2018 | 03/20/2018 | 03/29/2018 | 0.16810 | 0.16810 | - | - | - | - |
| 12/18/2017 | 12/19/2017 | 12/29/2017 | 0.23400 | 0.23400 | - | - | - | - |
| 09/18/2017 | 09/19/2017 | 09/29/2017 | 0.21784 | 0.21784 | - | - | - | - |
| 06/16/2017 | 06/20/2017 | 06/30/2017 | 0.18353 | 0.18353 | - | - | - | - |
| 03/17/2017 | 03/21/2017 | 03/31/2017 | 0.01403 | 0.01403 | - | - | - | - |
| 12/16/2016 | 12/20/2016 | 12/30/2016 | 0.45694 | 0.45694 | - | - | - | - |
| 09/16/2016 | 09/20/2016 | 09/30/2016 | 0.19530 | 0.19530 | - | - | - | - |
| 06/17/2016 | 06/21/2016 | 06/30/2016 | 0.17000 | 0.17000 | - | - | - | - |
| 03/18/2016 | 03/22/2016 | 03/31/2016 | 0.14146 | 0.14146 | - | - | - | - |
| 12/18/2015 | 12/22/2015 | 12/31/2015 | 0.23694 | 0.23694 | - | - | - | - |
| 09/18/2015 | 09/22/2015 | 09/30/2015 | 0.18776 | 0.18776 | - | - | - | - |
| 06/19/2015 | 06/23/2015 | 06/30/2015 | 0.19351 | 0.19351 | - | - | - | - |
| 03/20/2015 | 03/24/2015 | 03/31/2015 | 0.14546 | 0.14546 | - | - | - | - |
| 12/19/2014 | 12/23/2014 | 12/31/2014 | 0.20504 | 0.20504 | - | - | - | - |
| 09/19/2014 | 09/23/2014 | 09/30/2014 | 0.12951 | 0.12951 | - | - | - | - |
| 06/20/2014 | 06/24/2014 | 06/30/2014 | 0.16723 | 0.16723 | - | - | - | - |
| 03/21/2014 | 03/25/2014 | 03/31/2014 | 0.10087 | 0.10087 | - | - | - | - |
| 12/24/2013 | 12/27/2013 | 12/30/2013 | 0.01467 | 0.01467 | - | - | - | - |
| 12/20/2013 | 12/24/2013 | 12/31/2013 | 0.19884 | 0.19884 | - | - | - | - |
| 09/20/2013 | 09/24/2013 | 09/30/2013 | 0.13062 | 0.13062 | - | - | - | - |
| 06/21/2013 | 06/25/2013 | 06/28/2013 | 0.11224 | 0.11224 | - | - | - | - |
| 03/15/2013 | 03/19/2013 | 03/28/2013 | 0.09491 | 0.09491 | - | - | - | - |
| 12/21/2012 | 12/26/2012 | 12/31/2012 | 0.16804 | 0.16804 | - | - | - | - |
| 09/21/2012 | 09/25/2012 | 09/28/2012 | 0.12429 | 0.12429 | - | - | - | - |
| 06/15/2012 | 06/19/2012 | 06/29/2012 | 0.11506 | 0.11506 | - | - | - | - |
| 03/16/2012 | 03/20/2012 | 03/30/2012 | 0.08287 | 0.08287 | - | - | - | - |
| 12/16/2011 | 12/20/2011 | 12/30/2011 | 0.12787 | 0.12787 | - | - | - | - |
| 09/16/2011 | 09/20/2011 | 09/30/2011 | 0.14381 | 0.14381 | - | - | - | - |
Frequency Distribution of Discounts & Premiums
| Bid/Ask MidPoint Above NAV | |||||||
|---|---|---|---|---|---|---|---|
| Quarter Ending |
Days | 0.00- 0.25% |
0.26- 0.50% |
0.51- 0.99% |
1.00- 1.49% |
1.50- 1.99% |
≥2.00% |
| 06/30/2025 | 62 | 37 | 0 | 0 | 0 | 0 | 0 |
| 03/31/2025 | 60 | 31 | 1 | 2 | 0 | 0 | 0 |
| 12/31/2024 | 64 | 33 | 1 | 0 | 0 | 0 | 0 |
| 09/30/2024 | 64 | 27 | 0 | 0 | 0 | 0 | 0 |
| Year Ended 2024 | 252 | 118 | 1 | 0 | 0 | 0 | 0 |
| Bid/Ask Midpoint Below NAV | |||||||
|---|---|---|---|---|---|---|---|
| Quarter Ending |
Days | 0.00- 0.25% |
0.26- 0.50% |
0.51- 0.99% |
1.00- 1.49% |
1.50- 1.99% |
≥2.00% |
| 06/30/2025 | 62 | 25 | 0 | 0 | 0 | 0 | 0 |
| 03/31/2025 | 60 | 25 | 1 | 0 | 0 | 0 | 0 |
| 12/31/2024 | 64 | 30 | 0 | 0 | 0 | 0 | 0 |
| 09/30/2024 | 64 | 37 | 0 | 0 | 0 | 0 | 0 |
| Year Ended 2024 | 252 | 133 | 0 | 0 | 0 | 0 | 0 |
Fund Inception : 06/16/2011
Shareholders may pay more than net asset value when they buy Fund shares and receive less than net asset value when they sell those shares, because shares are bought and sold at current market prices. Performance data quoted represents past performance, which is not a guarantee of future results.
Shareholders may pay more than net asset value when they buy Fund shares and receive less than net asset value when they sell those shares, because shares are bought and sold at current market prices. Performance data quoted represents past performance, which is not a guarantee of future results.
Fund Documents
Risk & Other Information
Typically, security classifications used in calculating allocation tables are as of the last trading day of the previous month.
There are risks involved with investing in ETFs, including possible loss of money. Shares are not actively managed and are subject to risks similar to those of stocks, including those regarding short selling and margin maintenance requirements. Ordinary brokerage commissions apply. The Fund's return may not match the return of the Underlying Index. The Fund is subject to certain other risks. Please see the current prospectus for more information regarding the risk associated with an investment in the Fund.
Investments focused in a particular industry or sector are subject to greater risk, and are more greatly impacted by market volatility, than more diversified investments.
A momentum style of investing is subject to the risk that the securities may be more volatile than the market as a whole or returns on securities that have previously exhibited price momentum are less than returns on other styles of investing.
A value style of investing is subject to the risk that the valuations never improve or that the returns will trail other styles of investing or the overall stock markets.
Stocks of medium-sized companies tend to be more vulnerable to adverse developments, may be more volatile, and may be illiquid or restricted as to resale.
The Fund may become “non-diversified”, as defined under the Investment Company Act of 1940, as amended, solely as a result of a change in relative market capitalization or index weighting of one or more constitutes of the Index. Shareholder approval will not be sought when the Fund crosses from diversified to non-diversified status under such circumstances.
The Russell Top 200® Index measures the performance of the largest cap segment of the US equity universe. The Russell 1000® Value Index is an unmanaged index considered representative of large-cap value stocks. The Russell Top 200 Pure Value Index is composed of securities with strong value characteristics selected from the Russell Top 200 Index. Russell is a trademark/service marks of the Frank Russell Co. Russell® is a trademark of the Frank Russell Co. The RAFI Fundamental Large Value Index is composed of common stocks of large value US companies based on fundamental weight.
The Global Industry Classification Standard was developed by and is the exclusive property and a service mark of MSCI, Inc. and Standard & Poor's.
S&P® is a registered trademark of Standard & Poor's Financial Services LLC (S&P) and Dow Jones® is a registered trademark of Dow Jones Trademark Holdings LLC (Dow Jones). These trademarks have been licensed for use by S&P Dow Jones Indices LLC. S&P® and Standard & Poor's® are trademarks of S&P and Dow Jones® is a trademark of Dow Jones. These trademarks have been sublicensed for certain purposes by Invesco Capital Management LLC. The Index is a product of S&P Dow Jones Indices LLC and/or its affiliates and has been licensed for use by Invesco. The Fund is not sponsored, endorsed, sold or promoted by S&P Dow Jones Indices LLC, Dow Jones, S&P or their respective affiliates and neither S&P Dow Jones Indices LLC, Dow Jones, S&P or their respective affiliates make any representation regarding the advisability of investing in such product(s). The Russell Top 200® Pure Value Index is a trademark of Frank Russell Company and has been licensed for use by Invesco. The Product is not sponsored, endorsed, sold or promoted by Frank Russell Company and Frank Russell Company makes no representation regarding the advisability of investing in the Product.
 United States
 Canada (English)
 United Kingdom
 Isle of Man
 Jersey
 Guernsey
 Australia
 China
China Hong Kong
 Japan
Japan Taiwan
 Europe
 Dubai
Dubai