Is it the start of a turnaround in China equities?
The recent bear market in China equities, which began in early 2021, has lasted 64 weeks, or 6 weeks longer than the average duration of prior bear markets, as of early May this year. The market drawdown during this stretch reached 33% which is close to the past average drawdown of 40% during the period between 2005 to 2018.
Based on historical precedents, we believe onshore stocks have already shown signs of bottoming. Since the trough in late April, the CSI 300 has surged by more than 18% (Figure 1). We do not expect this rally to be short-lived and instead think this could be the beginning of a turnaround in China equities.
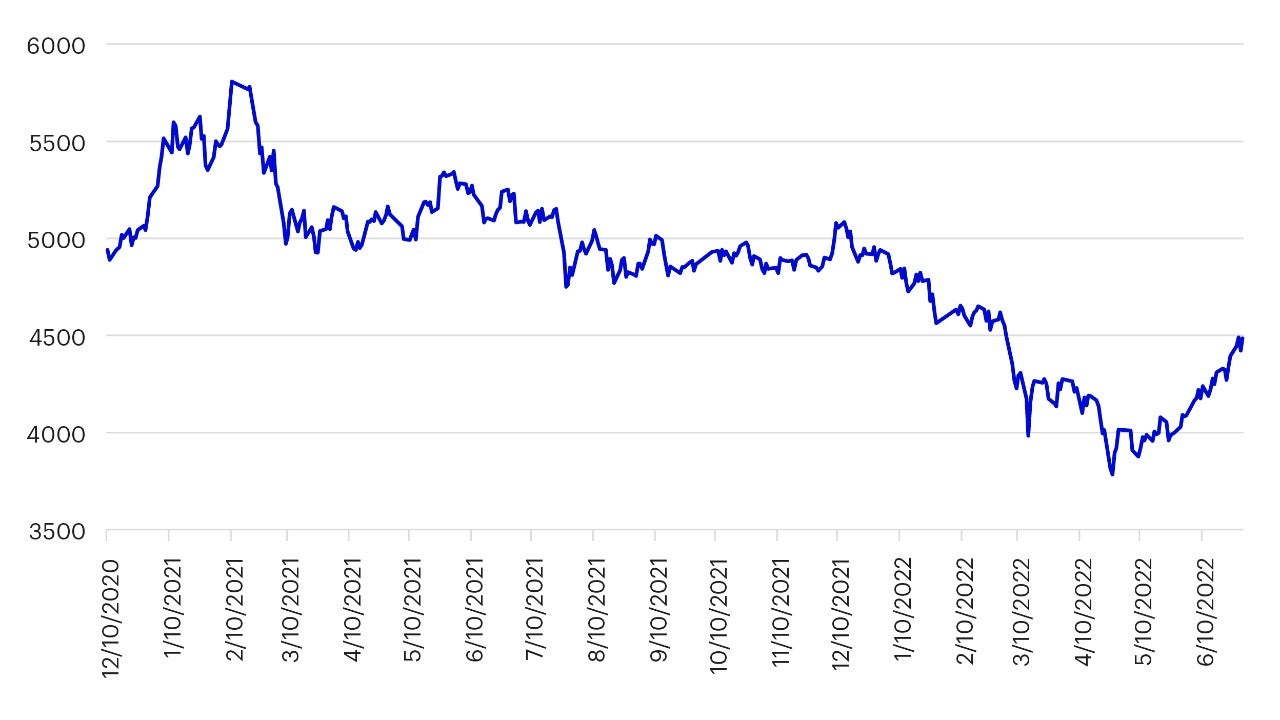
Source: CSI 300, data as of June 30, 2022. Past performance is not a guide to future returns.
In Figure 2 we chart the history of bear markets over the past 17 years as indicated by the performance of the CSI 300 index. We define a bear cycle as a cumulative index drawdown of at least 20% (using weekly data). The recent market drawdown of 33% as of late April is slightly lower than the 40% seen historically over the period from 2005 to 2018 (Figure 3).
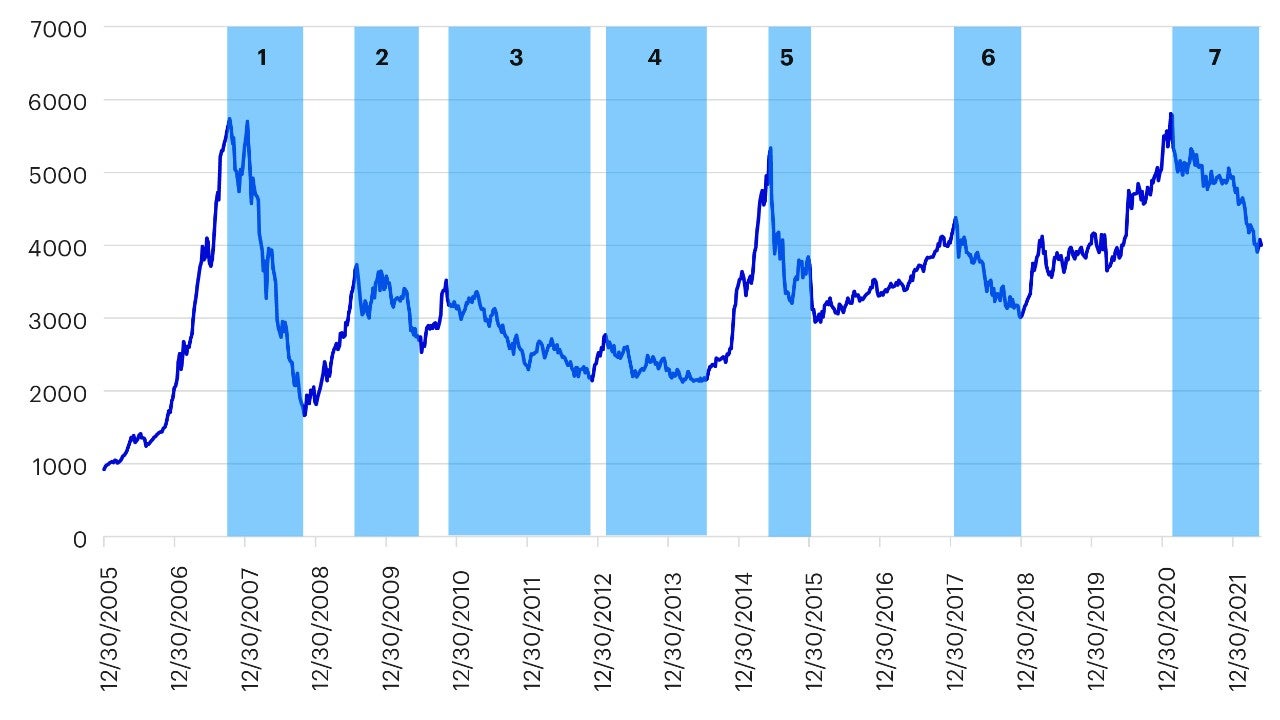
Source: Invesco, Bloomberg, data as of June 24, 2022. Past performance is not a guide to future returns.

Source: Invesco, Bloomberg, data as of May 6, 2022; Period: 30 Dec 2005 to 31 Dec 2018. Note: Bear markets defined by cumulative index drawdown of at least 20% based on CSI300 Index weekly data. Past performance is not a guide to future returns.
China’s regulatory easing is gathering speed and the country is slowly reopening
The China equities market experienced a series of regulatory tightening measures in the latter half of 2021. The policy environment for 2022 was widely anticipated to be more supportive and in recent months we have seen five key developments that indicate regulatory easing is gaining momentum.
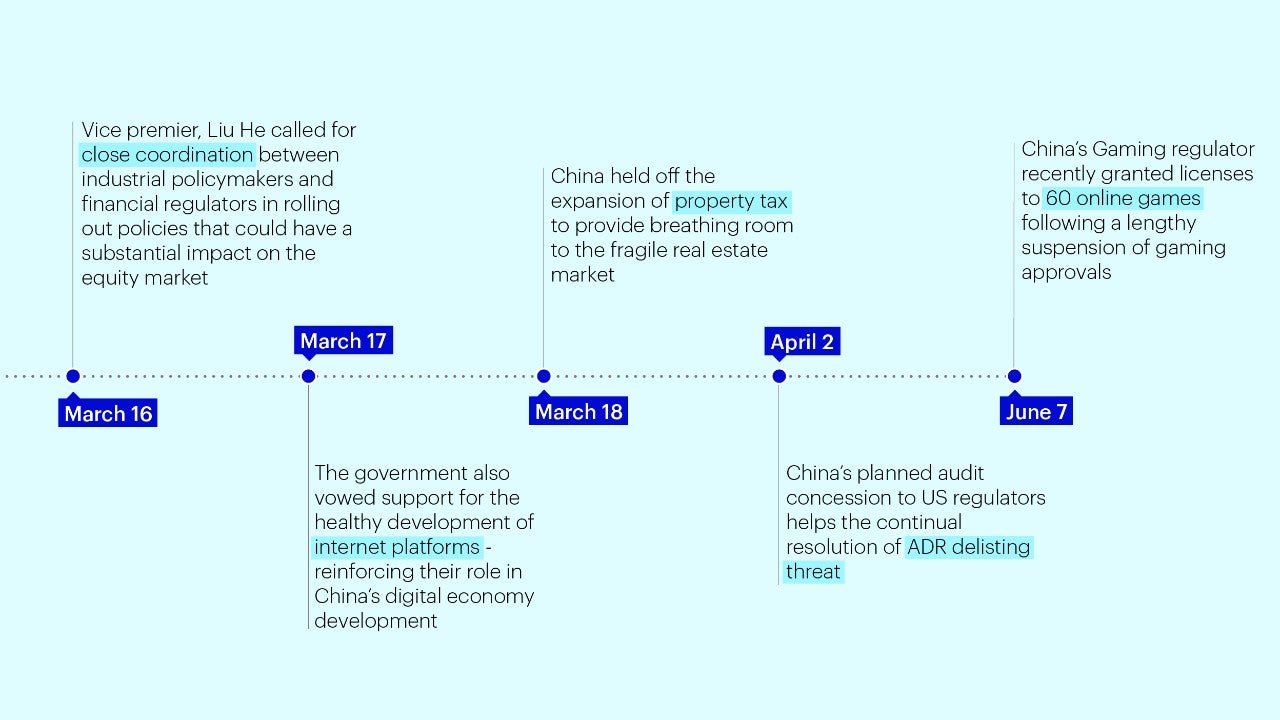
Source: Invesco, for illustrative purposes only.
Major cities in China are also opening up quickly after the most recent Omicron wave. Shanghai fully opened up in June after achieving zero society-wide cases. Beijing’s daily cases have also dropped to single digit numbers.
While policymakers continue to pursue a zero-COVID policy, since the National People's Congress they have announced a series of growth stabilizing measures to support small and medium enterprises as well as the labor market. These include 33 new stimulus measures announced by the State Council to boost the economy in May.
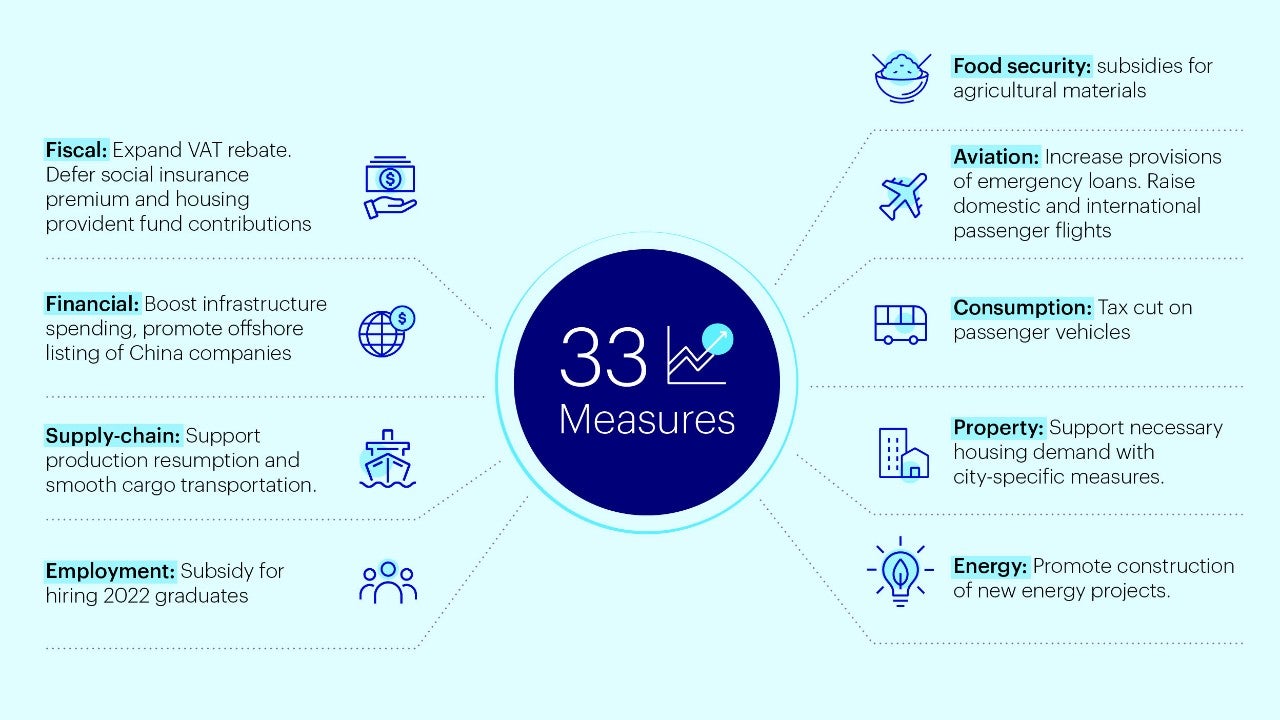
Source: Invesco, for illustrative purposes only.
As of late June, China has also cut the quarantine time for inbound travelers by half, viewed as the biggest shift yet in their Covid-19 policy.
While China’s zero-COVID policy has strongly impacted economic growth, there are several A-shares sectors that have held up well in the first quarter of this year amid the headwinds, namely the semiconductor, energy, and healthcare sectors.
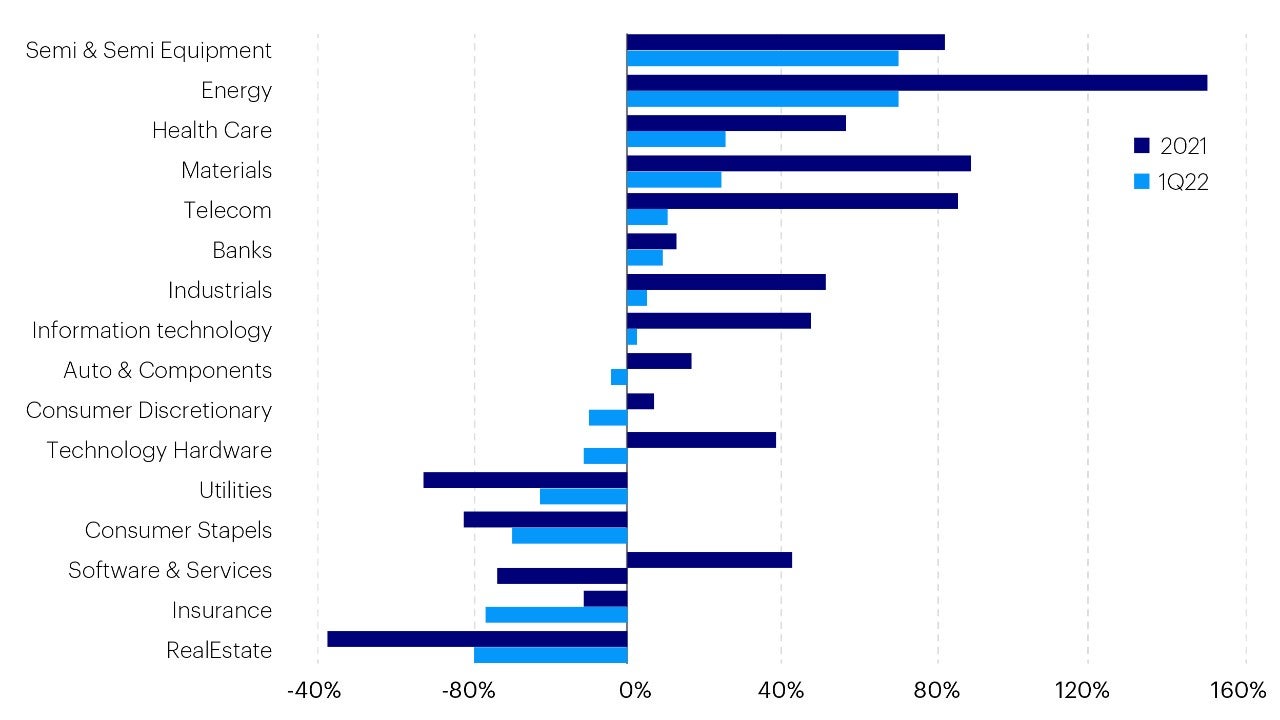
Source: Wind, BofA Global Research, data as of May 4, 2022. Past performance is not a guide to future returns.
The semiconductor sector delivered strong 70% YoY earnings growth in the first quarter of this year on the back of the structural trend of import substitution and high prices of semiconductor products due to pandemic-induced supply chain disruption. The Russia-Ukraine conflict has benefited the energy sector given the surge in oil and gas prices. China’s healthcare sector’s earnings have also been quite resilient in spite of the negative impacts that have resulted from volume-based procurement.
A-share’s low cyclical valuation may signal an attractive entry point
The cyclically adjusted price-earnings ratio (CAPE) for Chinese equities (15.3) is currently the lowest among major developed and emerging markets and at the bottom end of their own historical range (Figure 7). We believe this may reflect an overly cautious investor stance.
As outlined, we think the factors behind China’s equity market underperformance may be reversing. In such an instance, the odds will be that China’s CAPE could revert to its long-term average.
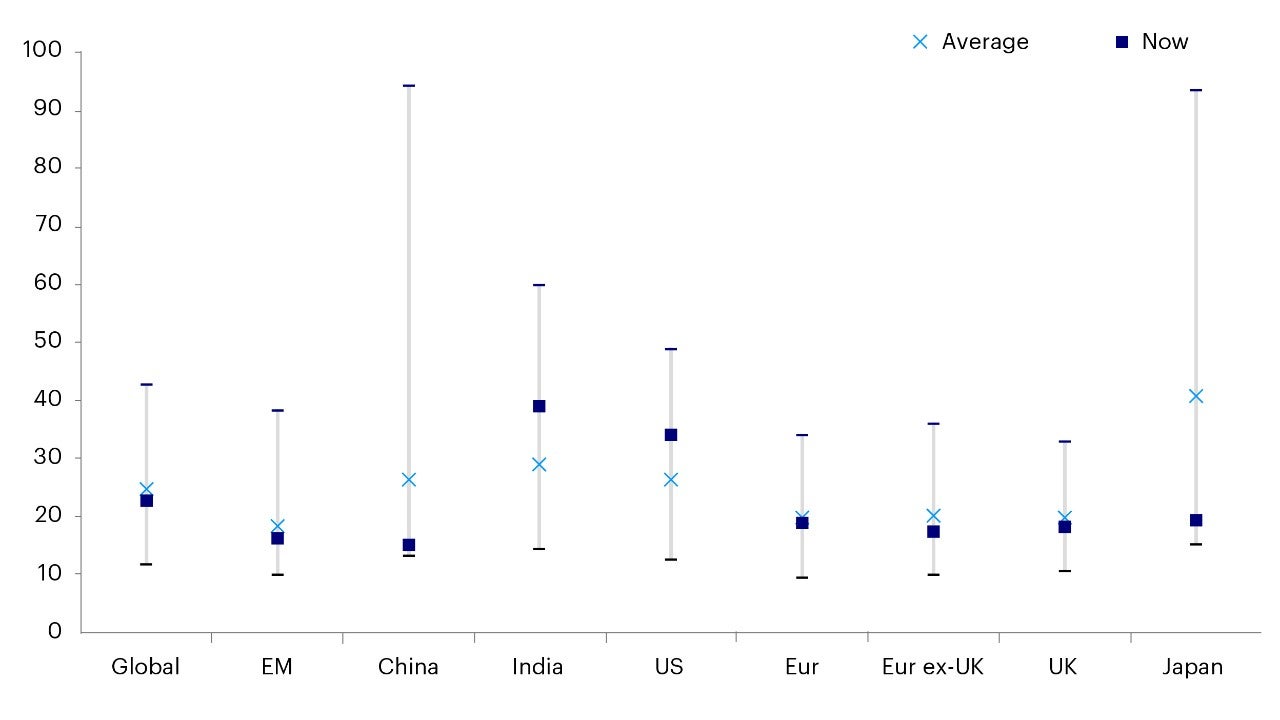
Source: Refinitiv Datastream and Invesco, data as of 26 May 2022. Cyclically Adjusted Price/Earnings uses a 10-year moving average of earnings. Based on daily data from 3 January 1983 (except for China from 1 April 2004, India from 31 December 1999 and EM from 3 January 2005), using Datastream indices.
Even after the recent market rebound, China’s equity risk premium remains attractive and may have room to increase with any rate cuts this year. Past history also suggests that the probability of market upside could now outweigh the downside at or above this premium.
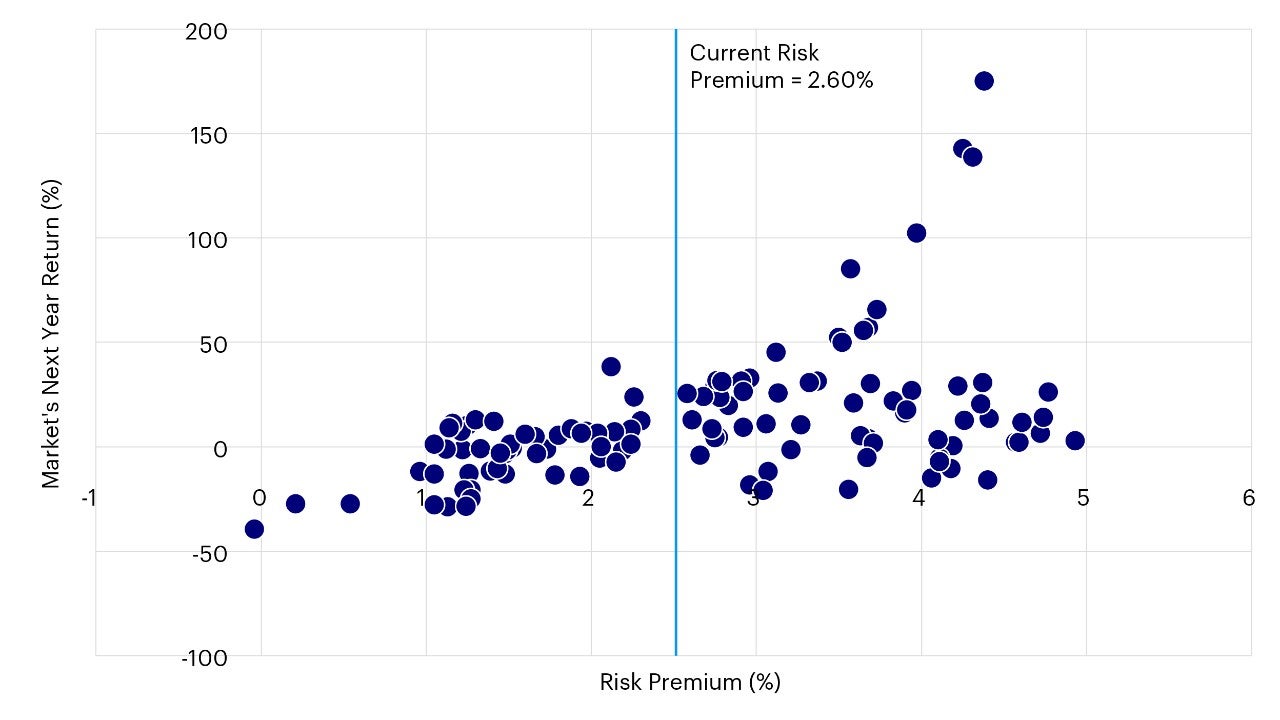
Source: Wind All China Index, data as of 28 June 2022. Note: Scatter chart shows risk premium levels relative to next 12-month market return using data from May 31, 2011, to May 31, 2022. The vertical line indicates the latest risk premium of 2.60% as of June 28, 2022.
We also expect equity flows may increase, spurred by domestic and foreign buying. In particular the suppression of property prices may spur the allocation of household investable income into the equity market (Figure 9). After trimming their positions during the initial lockdown that occurred in Shanghai in March, northbound investors have become strong net buyers (Figure 10) in Q2 2022.
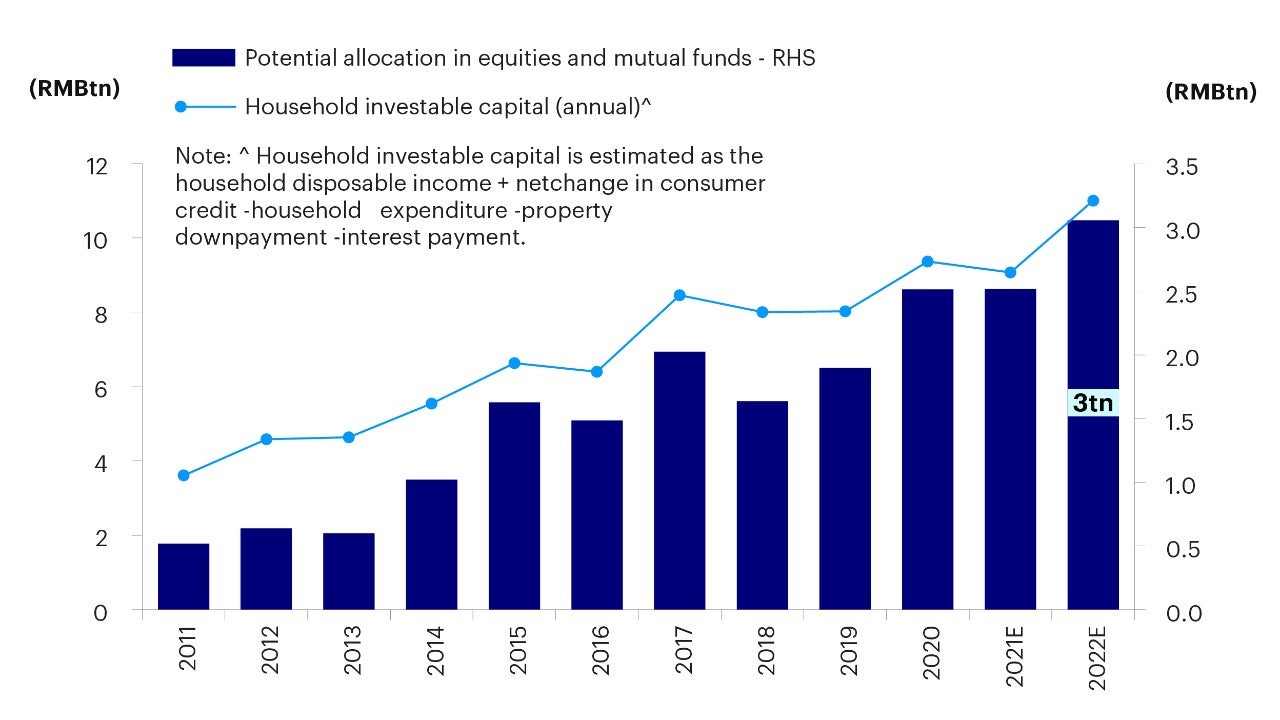
Source: CEIC, Bloomberg, Goldman Sachs Global Investment Research, data as of Feb 13, 2022.
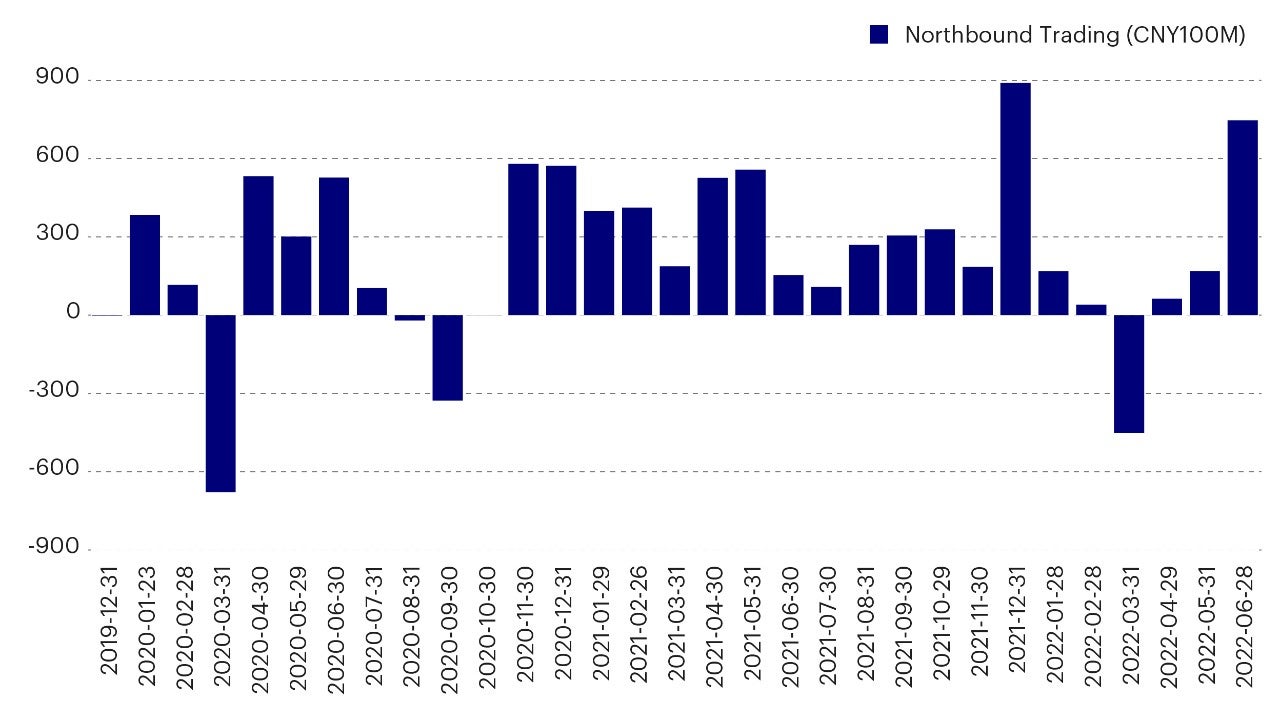
Source: Wind, monthly data as of June 28, 2022
Investment risks
The value of investments and any income will fluctuate (this may partly be the result of exchange rate fluctuations) and investors may not get back the full amount invested.
When investing in less developed countries, you should be prepared to accept significantly large fluctuations in value.
Investment in certain securities listed in China can involve significant regulatory constraints that may affect liquidity and/or investment performance.
当資料ご利用上のご注意
当資料は情報提供を目的として、インベスコ・アセット・マネジメント株式会社(以下、「当社」)のグループに属する運用プロフェッショナルが英文で作成したものであり、法令に基づく開示書類でも特定ファンド等の勧誘資料でもありません。内容には正確を期していますが、必ずしも完全性を当社が保証するものではありません。また、当資料は信頼できる情報に基づいて作成されたものですが、その情報の確実性あるいは完結性を表明するものではありません。当資料に記載されている内容は既に変更されている場合があり、また、予告なく変更される場合があります。当資料には将来の市場の見通し等に関する記述が含まれている場合がありますが、それらは資料作成時における作成者の見解であり、将来の動向や成果を保証するものではありません。また、当資料に示す見解は、インベスコの他の運用チームの見解と異なる場合があります。過去のパフォーマンスや動向は将来の収益や成果を保証するものではありません。当社の事前の承認なく、当資料の一部または全部を使用、複製、転用、配布等することを禁じます。
IM2022-044
そのほかの投資関連情報はこちらをご覧ください。https://www.invesco.com/jp/ja/institutional/insights.html


