Tactical Asset Allocation: August 2022

We enter a global contraction regime. We reduce portfolio risk to underweight relative to benchmark, underweighting equity and credit risk relative to government bonds. We provide an historical overview of contraction regimes in our framework going back to the 1970s.
Synopsis
- Our macro framework enters a contraction regime for the first time since February 2020, led by deterioration in US and Eurozone economic activity, and ongoing deceleration in global risk appetite. This regime is consistent with central banks’ objectives of achieving below-trend growth, weakening the labor market, and reducing inflation.
- We have reduced portfolio risk to underweight relative to benchmark in the Global Tactical Asset Allocation model1 , expressing a defensive bias across most levers in the portfolio. We underweight equity vs. fixed income, underweight credit risk2 and overweight duration relative to benchmark.
Macro update
The economy continues to deteriorate, and our global leading economic indicator has declined below its long-term trend for the first time since Q2 2020, led by noticeable declines in the US and the Eurozone. The positive momentum in Japan has dissipated, while the UK, China and the rest of emerging markets have seen some improvements over the past month. Coupled with decelerating global risk appetite, our macro regime framework has now moved to a contraction regime, anticipating growth below its long-term trend and deteriorating (Figure 1 and Figure 2). Both the US and the aggregate developed ex-US LEI declined for the third consecutive month and moved below their long-term trend, placing the developed world in contraction. Contributions to this decline were broad based across variables and economic sectors, namely business surveys, housing indicators, industrial orders, consumer sentiment and labor market conditions in manufacturing. Noticeably, consumer sentiment remains at recessionary levels, while business and housing conditions are declining from cyclical peaks.
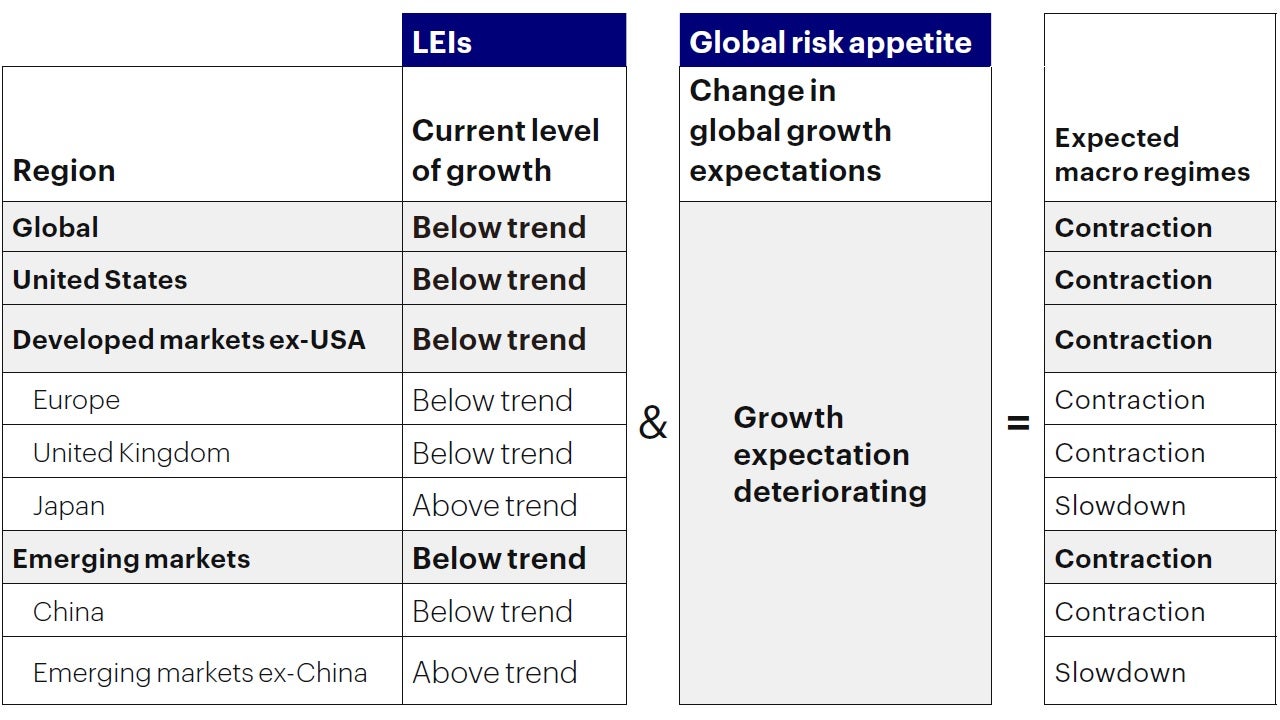
The positive momentum in Japan has dissipated, while the UK, China and the rest of emerging markets have seen some improvements over the past month.
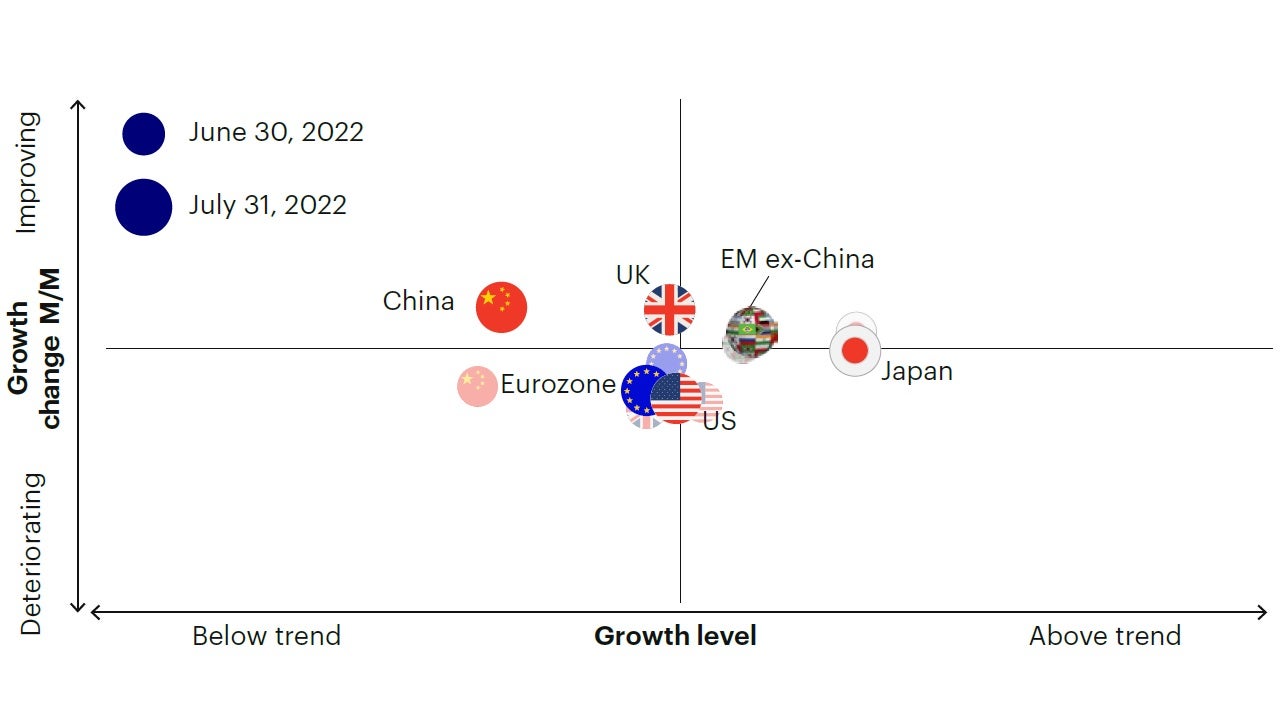
Sources: Bloomberg L.P., Macrobond. Invesco Investment Solutions research and calculations. Proprietary leading economic indicators of Invesco Investment Solutions. Macro regime data as of July 31, 2022. The Leading Economic Indicators (LEIs) are proprietary, forward-looking measures of the level of economic growth. The Global Risk Appetite Cycle Indicator (GRACI) is a proprietary measure of the markets’ risk sentiment.
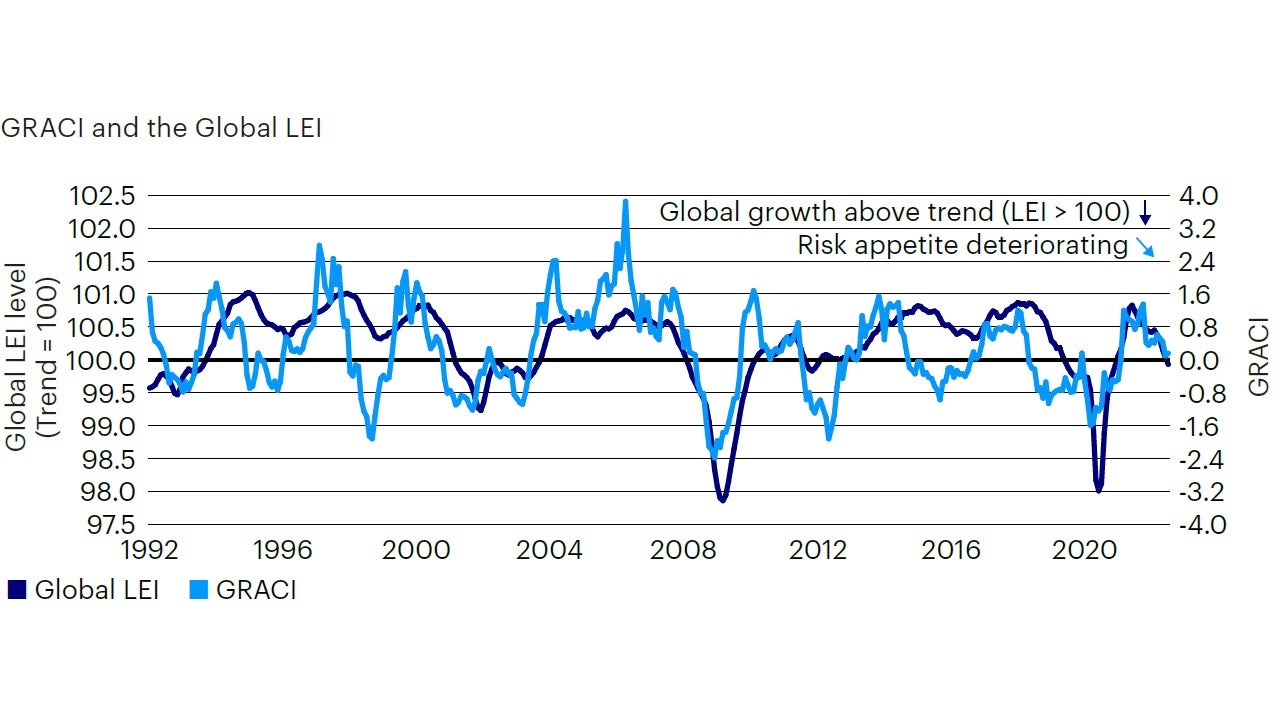
Sources: Bloomberg L.P., MSCI, FTSE, Barclays, JPMorgan, Invesco Investment Solutions research and calculations, from Jan. 1, 1992 to July 31, 2022. The Global Leading Economic Indicator (LEI) is a proprietary, forward-looking measure of the growth level in the economy. A reading above (below) 100 on the Global LEI signals growth above (below) a long-term average. The Global Risk Appetite Cycle Indicator (GRACI) is a proprietary measure of the markets’ risk sentiment. A reading above (below) zero signals a positive (negative) compensation for risk taking in global capital markets in the recent past. Past performance does not guarantee future results.
We are strongly committed to bringing inflation back down and we are moving expeditiously to do so. The labor market is extremely tight, and inflation is much too high”. Further, “we are determined to take the measures necessary to return inflation to our 2% long-term goal. This process is likely to involve a period a below-trend economic growth and some softening in labor market conditions, but such outcomes are likely necessary to restore price stability and to set the stage for achieving maximum employment and stable prices over the longer run”.
As anticipated in our last update, this transition to a contractionary regime had become increasingly likely, as economic data began adjusting to the rapid tightening in monetary and credit conditions. Further, these developments are perfectly consistent with central banks’ objective to rein in inflationary pressures. As stated by Fed Chair Jerome Powell at the July FOMC meeting press conference: (see quote along side bar)
Walking that delicate balance between growing below potential while avoiding a recession is an extremely difficult task for any central bank to achieve. Monetary policy is a very powerful tool, but not a precision tool, as interest rate increases take several quarters to impact growth and inflation, providing delayed feedback from the economy back to policy makers and financial markets. As the unemployment rate begins to rise, which is a necessary condition to curb inflation on the demand side, the economy becomes more vulnerable to shocks, as business and consumer sentiment can suddenly sour in response to tighter credit conditions and shrinking profits.
Haven’t we already experienced a technical recession in 1H 2022?
While this back-to-back quarterly contraction meets the definition of a technical recession, most economists, and the Federal Reserve, argue that a real recession means broad-based declines in many indicators across the economy. We agree with this assessment.
The first two quarters of 2022 signal this slowing process is already underway with US GDP declining by 0.9% in Q2, following a 1.6% contraction in Q1. In the second quarter the decline was led by private inventory investment, residential and nonresidential fixed investment, and government spending, while a large decline in net exports, led by a large increase in imports, explained the decline in Q1. While this back-to-back quarterly contraction meets the definition of a technical recession, most economists, and the Federal Reserve, argue that a real recession means broad-based declines in many indicators across the economy. We agree with this assessment. Looking at continued growth in consumer spending between Q1 (+0.70%) and Q2 (1.24%), along with payroll increases and a record low unemployment rate, today’s economy does not feel like a recessionary environment. Not yet. Real final sales at +1.1% in Q2, after a -1.2% in Q1, is still indicative of a meaningful slowdown in the economy after the strong rebound in 2021.
Have markets already priced-in a recession?
Broadly speaking, equity and credit markets have not discounted the additional underperformance due to lower earnings growth to be expected in a recessionary scenario.
As discussed in our last note, we believe global markets are not pricing-in a recession, and that a simple acknowledgment of the large equity sell-off year-to-date may be misleading. The bulk of the underperformance in equity markets from the peak can be attributed to the increase in global bond yields, or higher discount rates applied to future cash-flows. The underperformance in global equities by about 15% year-to-date is largely in line with the underperformance in 30-year government bonds, also down approximately 20% year to date3. Broadly speaking, equity and credit markets have not discounted the additional underperformance due to lower earnings growth to be expected in a recessionary scenario.
What are the historical characteristics of “contractions” in our macro regime framework?
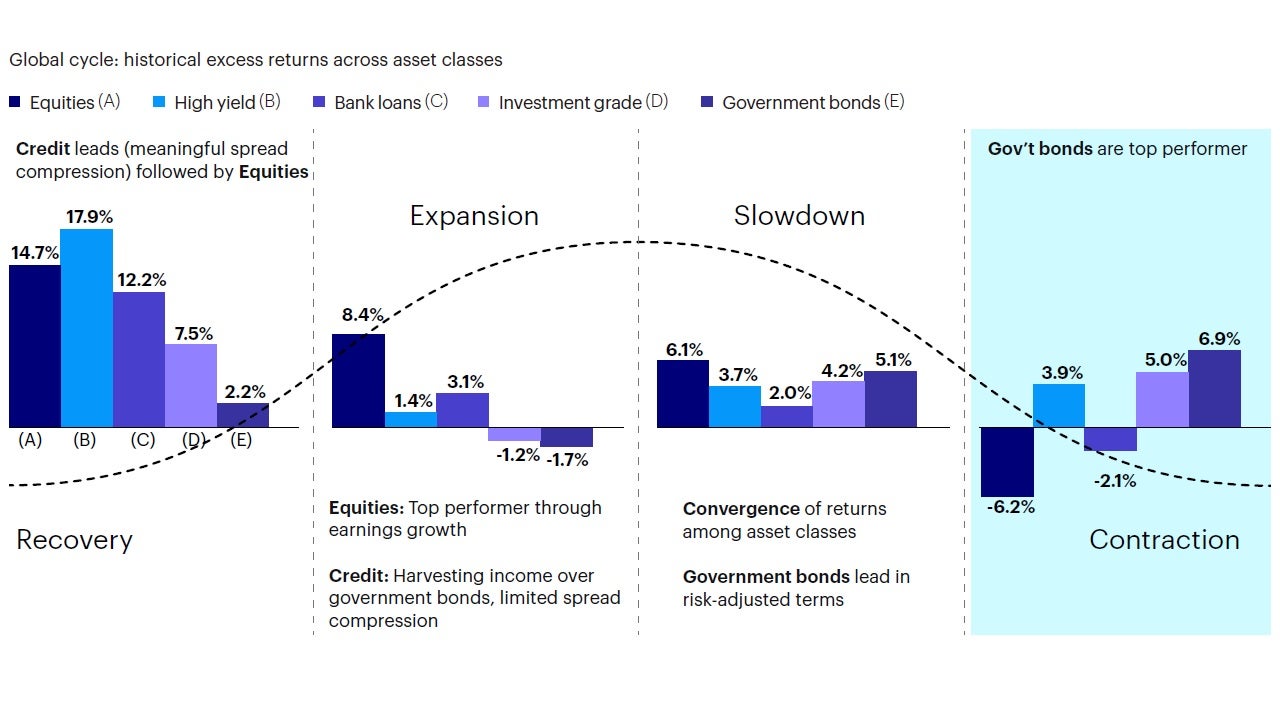
We define contractions as regimes with growth below its long-term trend and expected to decelerate, modeled with a combination of leading economic indicators and global risk appetite. Therefore, our definition of contraction includes recessions, but also includes periods when growth is expected to be below trend and decelerating, hence not necessarily negative. Going back to 1970, we find the following results4:
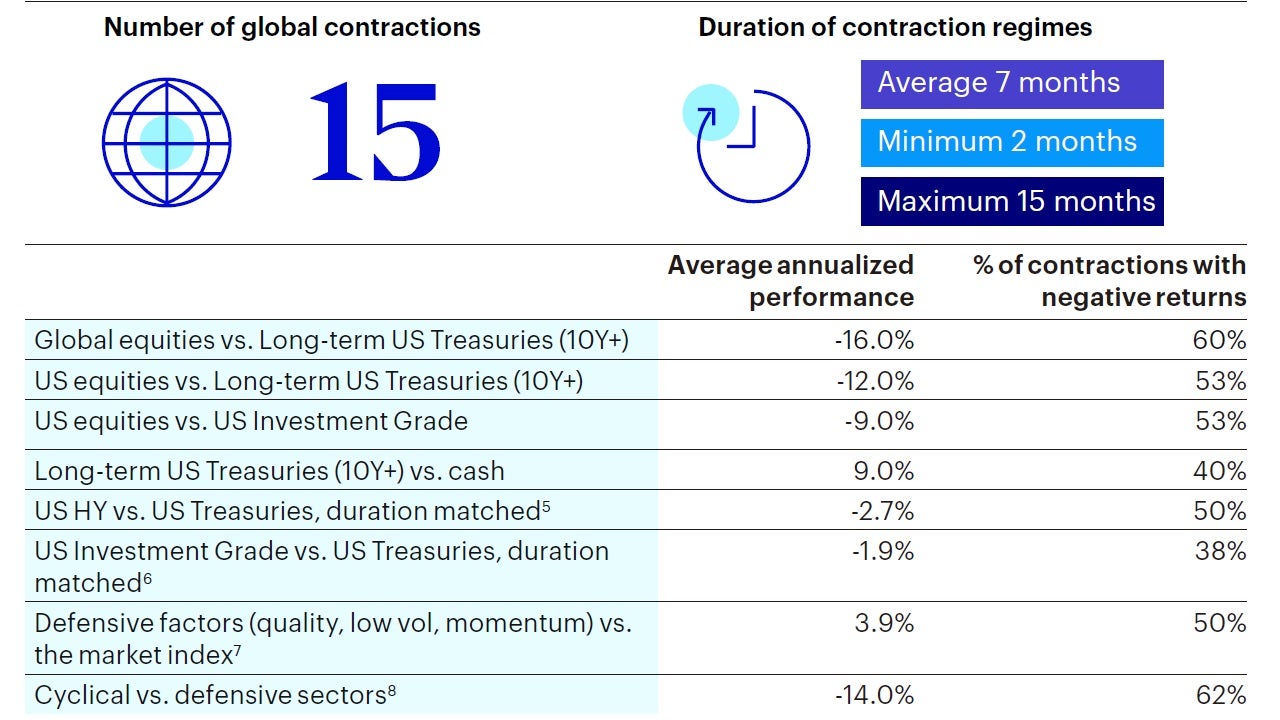
The numbers above highlight a clear skew towards a negative repricing of growth risk in the relative performance between equity, credit and government bonds, and a favorable repricing in favor of duration, defensive equity sectors and factors relative to cyclicals. However, as to be expected, not every contractionary episode has historically delivered the predicted outcome, with hit ratios below 62%. Finally, historical performance for major asset class across macro regime is summarized in Figure 3.
Sources: Bloomberg L.P., Macrobond. Invesco Investment Solutions research and calculations. Proprietary leading economic indicators of Invesco Investment Solutions. Macro regime data as of July 31, 2022. The Leading Economic Indicators (LEIs) are proprietary, forward-looking measures of the level of economic growth. The Global Risk Appetite Cycle Indicator (GRACI) is a proprietary measure of the markets’ risk sentiment.
What can we expect going forward? What type of contraction?
Today the magnitude and duration of a recession is likely to be a function of the growth decline the Fed needs to deliver, raising the unemployment rate by enough to bring core inflation back to 2%.
The prevailing consensus favors the odds of a mild recession, without an ensuing financial crisis, therefore favoring analogies to the templates of 1990 and 2001 rather than 2007- 2008. A reasonable justification for such parallels comes from the evidence that today we don’t see large financial excesses or imbalances in the economy. Taking the US as an example, private sector debt to GDP ratio is largely unchanged since 2019, while it had risen between 10%-20% of GDP in the 5-years before the start of each of past 3 recessions in 1990, 2001 and 2007. In other words, given a small adjustment required in private sector leverage, or savings rate, this metric alone may be indicative of a shallow, short-lived cyclical contraction. However, the past 30 years may not represent the most appropriate template given lack of inflationary pressures between 1990-2020.
Instead, today the economy is dealing with an inflation shock, and a required monetary policy tightening qualitatively more akin to the 1970s and 1980s, even though those inflationary shocks were quantitatively more severe in magnitude and, critically, entrenched in both short-term and long-term inflationary expectations. This is not the case today based on breakeven inflation rates. Therefore, today the magnitude and duration of a recession is likely to be a function of the growth decline the Fed needs to deliver, raising the unemployment rate by enough to bring core inflation back to 2%. Recessionary episodes in the 1970s and 1980s saw meaningful adjustments in growth and unemployment, to the order of 3-5%, when core inflation was running at about 10%. Core PCE today at 4.6% suggests the growth adjustments may not need to be as large. Hence, inflation remains the key and only relevant indicator to central bank policy today and, as a result, to the fate of this cycle. Our gauge of US inflation momentum provides some early indication of peaking inflationary pressures over the past 3-months, but it is too early to judge the persistence of this negative momentum (Figure 4).

Sources: Bloomberg L.P. data as of July 31, 2022, Invesco Investment Solutions calculations. The US Inflation Momentum Indicator (IMI) measures the change in inflation statistics on a trailing three-month basis, covering indicators across consumer and producer prices, inflation expectation surveys, import prices, wages, and energy prices. A positive (negative) reading indicates inflation has been rising (falling) on average over the past three months.
Investment positioning
We have reduced portfolio risk to underweight relative to benchmark in the Global Tactical Asset Allocation model, expressing a defensive bias across most levers in the portfolio. We underweight equity vs. fixed income, underweight credit risk9 and overweight duration relative to benchmark (Figure 5, 6, 7). In particular:
We expect these defensive characteristics to outperform in an environment of below-trend and slowing growth, declining inflation, and peaking bond yields.
Historically, a global contraction regime with tightening financial conditions has provided headwinds to emerging markets, offsetting positive local momentum.
- Within equities we maintain an underweight exposure to value, small and mid-cap equities, favoring defensive factors like quality and low volatility, and add momentum exposure, which tends to add defensive characteristics and downside protection during protracted downturns in the market. As a result, we continue to hold defensive sector exposures with higher duration characteristics and lower operating leverage such as information technology, communication services and health care, at the expense of financials, industrials, and materials (Figure 7). We expect these defensive characteristics to outperform in an environment of below-trend and slowing growth, declining inflation, and peaking bond yields. From a regional perspective, we maintain a moderate underweight in emerging markets relative to developed markets despite the modest improvements in the EM leading indicators. Historically, a global contraction regime with tightening financial conditions has provided headwinds to emerging markets, offsetting positive local momentum. We have neutralized the overweight in developed ex-US equities relative to the United States, as early signs of cyclical divergence dissipated.
- In fixed income we have further reduced exposure in risky credit as a contractionary regime has historically led to underperformance in high yield, bank loans and emerging markets relative to higher quality debt with similar duration. Hence, we go up in credit quality, favoring investment grade and government bonds. We have further increased duration, and increased exposure to nominal treasuries relative to inflation-linked bonds, expecting further compression in breakevens, as inflation decelerates.
- In currency markets we maintain a neutral exposure to the US dollar at this stage. Tighter US monetary policy and weakening global growth relative to consensus expectations provide support to the greenback, but valuations headwinds suggest better entry levels. Within developed markets we favor the euro, British pound, Norwegian kroner and Swedish krona relative to the Swiss Franc, Japanese yen, Australian and Canadian dollars. In EM we favor high yielders with attractive valuations as the Colombian peso and Brazilian real, while we underweight the Korean won and South African Rand.

Source: Invesco Investment Solutions, July 31, 2022. DM = developed markets. EM = emerging markets. FX = foreign exchange. For illustrative purposes only.

Source: Invesco Investment Solutions, July 31, 2022. For illustrative purposes only. Neutral refers to an equally weighted factor portfolio.

Source: Invesco Investment Solutions, July 31, 2022. For illustrative purposes only. Sector allocations derived from factor and style allocations based on proprietary sector classification methodology. As of June 2022, Cyclicals: energy, financials, industrials, materials; Defensives: consumer staples, health care, information technology, real estate, communication services, utilities; Neutral: consumer discretionary.
当資料ご利用上のご注意
当資料は情報提供を目的として、インベスコ・アセット・マネジメント株式会社(以下、「当社」)のグループに属する運用プロフェッショナルが英文で作成したものであり、法令に基づく開示書類でも金融商品取引契約の締結の勧誘資料でもありません。内容には正確を期していますが、必ずしも完全性を当社が保証するものではありません。また、当資料は信頼できる情報に基づいて作成されたものですが、その情報の確実性あるいは完結性を表明するものではありません。当資料に記載されている内容は既に変更されている場合があり、また、予告なく変更される場合があります。当資料には将来の市場の見通し等に関する記述が含まれている場合がありますが、それらは資料作成時における作成者の見解であり、将来の動向や成果を保証するものではありません。また、当資料に示す見解は、インベスコの他の運用チームの見解と異なる場合があります。過去のパフォーマンスや動向は将来の収益や成果を保証するものではありません。当社の事前の承認なく、当資料の一部または全部を使用、複製、転用、配布等することを禁じます。
20220815-2379928-JP
そのほかの投資関連情報はこちらをご覧ください。https://www.invesco.com/jp/ja/institutional/insights.html

