Tactical Asset Allocation: March 2022

Synopsis
Our framework remains in a slowdown regime. Historically, this economic backdrop has led to modest but positive returns across asset classes, with a convergence in performance between growth-sensitive and defensive assets, as compensation for growth risk diminishes.
The escalation of the Russia/Ukraine conflict increases downside risks to growth and increases upside risks to inflation, amplifying trends already in place for the past few quarters.
We maintain a neutral risk stance relative to our benchmark 1, with an overweight to equites versus fixed income but a tilt toward defensive equity factors (low volatility and quality) and sectors, and an overweight to developed market equities relative to emerging markets. We are overweight interest rate duration, overweight inflation-linked bonds, and underweight credit risk, with exposure to short and intermediate credit maturities.
Macro update
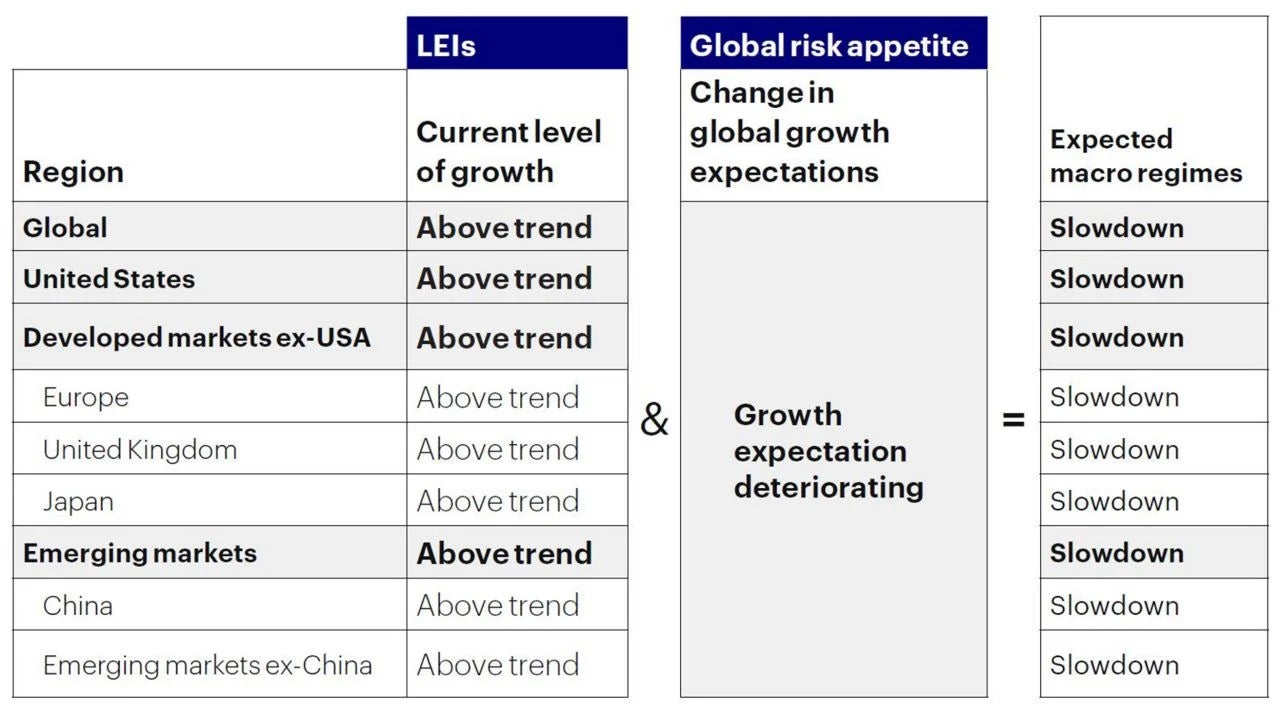
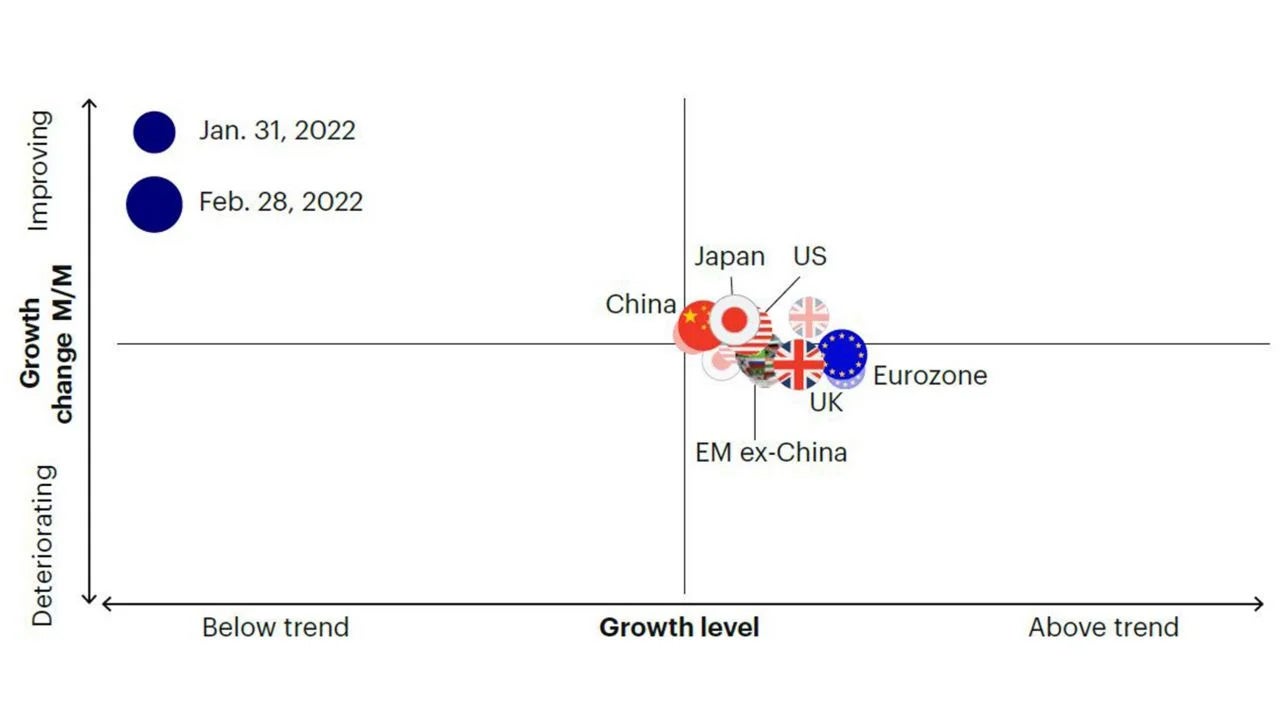
Our macro framework continues to point to a decelerating growth environment (Figure 1 and 2), coupled with rising inflationary pressures (Figure 3). The escalation of the Russia/ Ukraine conflict increases downside risks to growth and increases upside risks to inflation, amplifying trends already in place for the past few quarters. The impact on the economy and financial markets is propagated via several direct and indirect channels related to Russia’s dominant role in commodity markets, and the severe economic and financial sanctions imposed by the Western world.


Sources: Bloomberg L.P., Macrobond. Invesco Investment Solutions research and calculations. Proprietary leading economic indicators of Invesco Investment Solutions. Macro regime data as of Feb. 28, 2022. The Leading Economic Indicators (LEIs) are proprietary, forward-looking measures of the level of economic growth. The Global Risk Appetite Cycle Indicator (GRACI) is a proprietary measure of the markets’ risk sentiment.

Sources: Bloomberg L.P., MSCI, FTSE, Barclays, JPMorgan, Invesco Investment Solutions research and calculations, from Jan. 1, 1992 to Feb. 28, 2022. The Global Leading Economic Indicator (LEI) is a proprietary, forward-looking measure of the growth level in the economy. A reading above (below) 100 on the Global LEI signals growth above (below) a long-term average. The Global Risk Appetite Cycle Indicator (GRACI) is a proprietary measure of the markets’ risk sentiment. A reading above (below) zero signals a positive (negative) compensation for risk taking in global capital markets in the recent past. Past performance does not guarantee future results.
Commodity markets and upside risks to inflation
Russia and Ukraine are both major commodity producers. Russia represents about 12% of the world's oil production and 17% of natural gas production, supplying about 1/3 of Europe’s total natural gas consumption. In the metals market, while Russia represents a smaller share of production (between 5% and 10% of the world’s copper, nickel, and aluminum), there are important second-round effects to be considered as Russia’s energy powers about 40% of Europe’s aluminum production, an energy-intensive industry. Therefore, the overall impact on industrial metals is likely to be larger than Russia’s metals production numbers might suggest. Furthermore, Russia produces about 40% of the world’s palladium and 20% of platinum, key components to catalytic converters used in cars. Finally, Russia and Ukraine account for more than 30% of the world’s wheat exports and 20% of corn production, with a direct impact on agricultural commodities and global food prices.2 Resulting price pressures are emerging also in our inflation momentum indicator, primarily via imported inflation (Figure 3).

Sources: Bloomberg L.P. data as of Feb. 28, 2022, Invesco Investment Solutions calculations. The US Inflation Momentum Indicator (IMI) measures the change in inflation statistics on a trailing three-month basis, covering indicators across consumer and producer prices, inflation expectation surveys, import prices, wages, and energy prices. A positive (negative) reading indicates inflation has been rising (falling) on average over the past three months.
Footnotes
- Global 60/40 benchmark (60% MSCI ACWI / 40% Bloomberg Barclays Global Agg USD hedged)
- Sources: British Petroleum, US Department of Agriculture, Macobond
当資料ご利用上のご注意
当資料は情報提供を目的として、インベスコ・アセット・マネジメント株式会社(以下、「当社」)のグループに属する運用プロフェッショナルが英文で作成したものであり、法令に基づく開示書類でも金融商品取引契約の締結の勧誘資料でもありません。内容には正確を期していますが、必ずしも完全性を当社が保証するものではありません。また、当資料は信頼できる情報に基づいて作成されたものですが、その情報の確実性あるいは完結性を表明するものではありません。当資料に記載されている内容は既に変更されている場合があり、また、予告なく変更される場合があります。当資料には将来の市場の見通し等に関する記述が含まれている場合がありますが、それらは資料作成時における作成者の見解であり、将来の動向や成果を保証するものではありません。また、当資料に示す見解は、インベスコの他の運用チームの見解と異なる場合があります。過去のパフォーマンスや動向は将来の収益や成果を保証するものではありません。当社の事前の承認なく、当資料の一部または全部を使用、複製、転用、配布等することを禁じます。
20220330-2102262-JP
そのほかの投資関連情報はこちらをご覧ください。https://www.invesco.com/jp/ja/institutional/insights.html

