Tactical Asset Allocation: January 2023

Market sentiment continues to improve, and Europe shows early signs of a rebound. We remain overweight risk relative to benchmark, via emerging and developed ex-US equities, cyclical factors, and risky credit.
Synopsis
- Improving risk appetite is indicative of near-term prospects for a recovery, increasing the likelihood of improving growth, led by a rebound in Europe.
- We overweight portfolio risk in the Global Tactical Asset Allocation model1, favoring emerging and developed ex-US equities, value, smaller capitalizations, and cyclical sectors. Overweight risky credit, neutral duration and underweight the US dollar.
Macro update
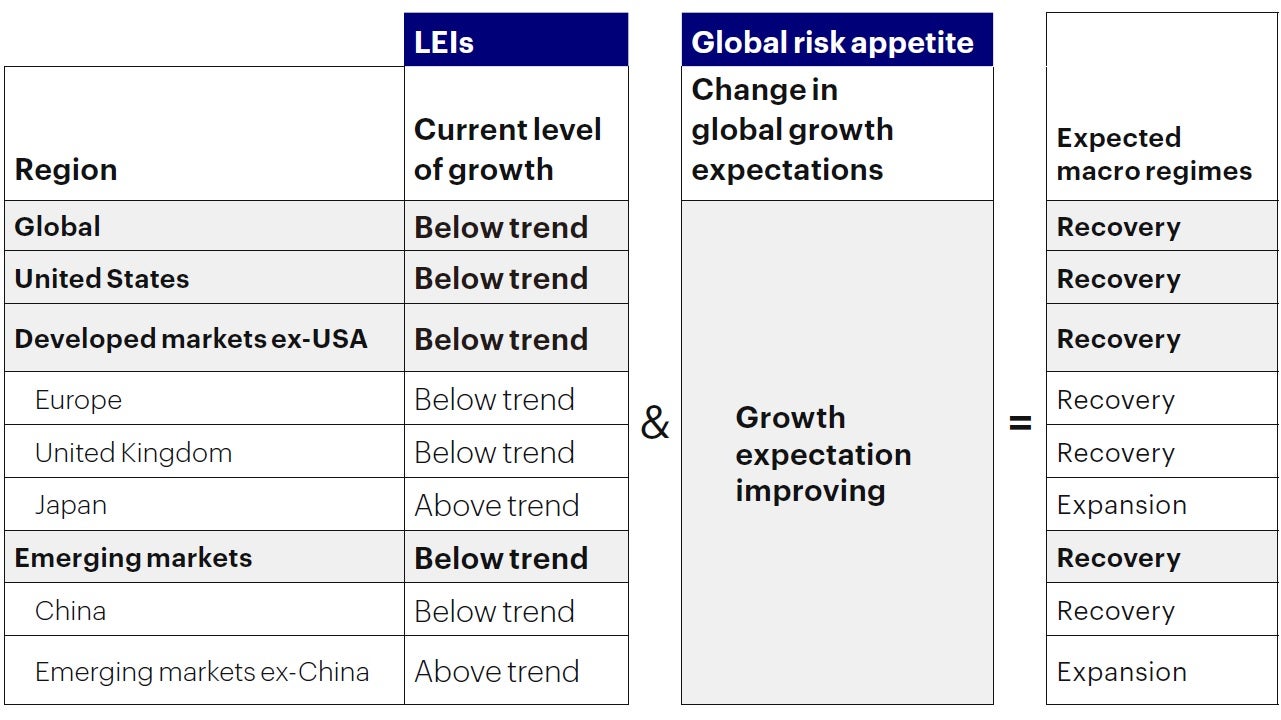
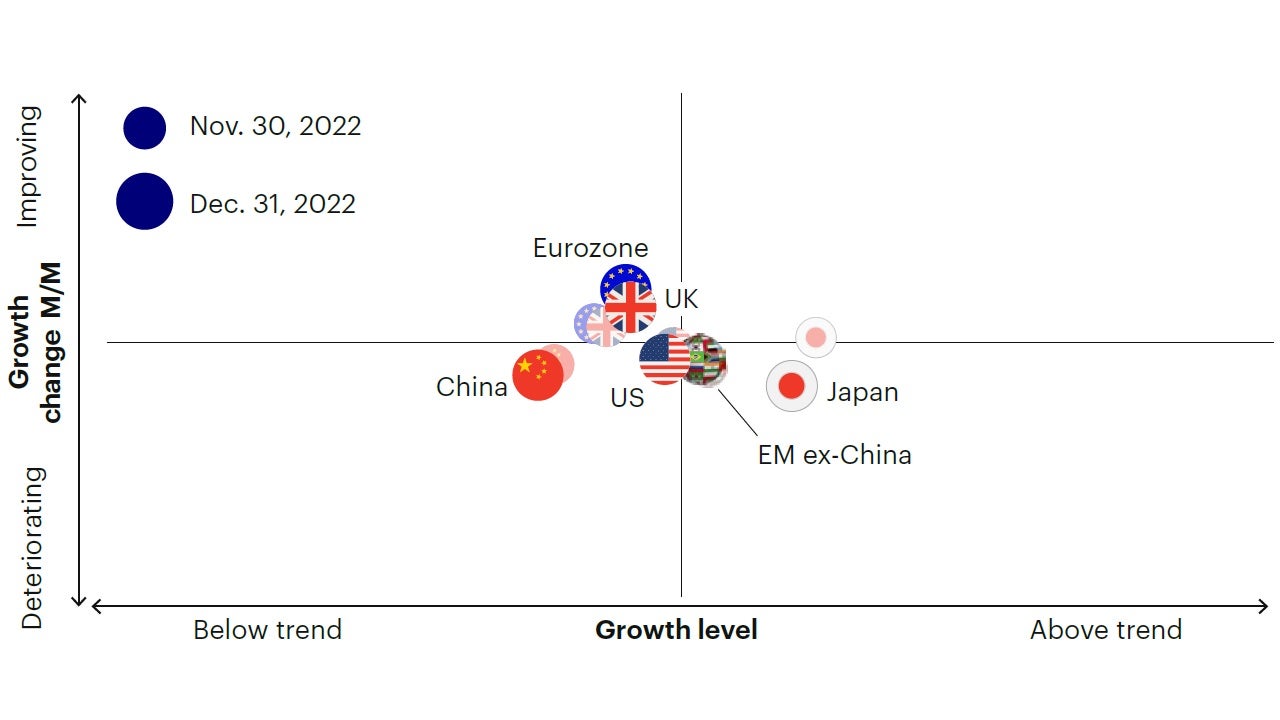
Market sentiment continues to improve. Our barometer of global risk appetite posted another noticeable increase over the past month, led by outperformance in emerging market (EM) equities relative to developed markets, tightening in sovereign EM spreads and US dollar depreciation. This type of inflections in market sentiment have historically presaged an improvement in growth expectations and earnings momentum, as evidenced by the strong positive correlation – approximately 78% with a lead of 3-months – between global risk appetite and indicators of the global business cycle (Figure 1, Figure2). As a result, our framework confirms the increasing likelihood of a recovery in the global economy. In fact, our regional leading economic indicators suggest this recovery may be already underway in the Eurozone and the UK, in sharp contrast with market consensus and recent downward growth revisions by the European Central Bank and Bank of England. While it is premature to assume durability in this rebound, signs of stabilization in Europe provide an important signal of resilience in the region that is most vulnerable to economic and confidence shocks from the Ukraine/Russia war. Indeed, this rebound in European indicators is led by a bottoming out in consumer sentiment surveys and improving manufacturing business sentiment.

Our regional leading economic indicators suggest this recovery may be already underway in the Eurozone and the UK, in sharp contrast with market consensus and recent downward growth revisions by the European Central Bank and Bank of England.

Sources: Bloomberg L.P., Macrobond. Invesco Investment Solutions research and calculations. Proprietary leading economic indicators of Invesco Investment Solutions. Macro regime data as of Dec. 31, 2022. The Leading Economic Indicators (LEIs) are proprietary, forward-looking measures of the level of economic growth. The Global Risk Appetite Cycle Indicator (GRACI) is a proprietary measure of the markets’ risk sentiment
Inflections in market sentiment have historically presaged an improvement in growth expectations and earnings momentum.

Sources: Bloomberg L.P., MSCI, FTSE, Barclays, JPMorgan, Invesco Investment Solutions research and calculations, from Jan. 1, 1992 to Dec. 31, 2022. The Global Leading Economic Indicator (LEI) is a proprietary, forward-looking measure of the growth level in the economy. A reading above (below) 100 on the Global LEI signals growth above (below) a long-term average. The Global Risk Appetite Cycle Indicator (GRACI) is a proprietary measure of the markets’ risk sentiment. A reading above (below) zero signals a positive (negative) compensation for risk taking in global capital markets in the recent past. Past performance does not guarantee future results.
We interpret this recovery regime as a repricing of near-term recession risks in terms of timing, duration, or magnitude
As discussed in our latest update, the expected improvement in growth is unlikely to represent the beginning of a new economic cycle given an unemployment rate near all-time lows. We interpret this recovery regime as a repricing of near-term recession risks in terms of timing, duration, or magnitude. Meaningful and persistent inversion in the yield curve is a reminder of elevated growth risks driven by tight monetary policy, and the Fed’s objective to stay restrictive until inflation has converged back to 2%. On this front, the latest inflation reports in the US confirm a gradual abating of price pressures, with monthly inflation now converging towards long-term policy targets, i.e., 0.2%-0.3% month-over-month, increasing the likelihood of the Fed signaling a pause in the tightening cycle in Q1, further supporting the recent rebound in global risk appetite. Declining price pressures are also confirmed by our measure of inflation momentum across economic sectors (Figure 3).
Declining price pressures are also confirmed by our measure of inflation momentum across economic sectors.

Sources: Bloomberg L.P. data as of Dec. 31, 2022, Invesco Investment Solutions calculations. The US Inflation Momentum Indicator (IMI) measures the change in inflation statistics on a trailing three-month basis, covering indicators across consumer and producer prices, inflation expectation surveys, import prices, wages, and energy prices. A positive (negative) reading indicates inflation has been rising (falling) on average over the past three months.
Investment positioning
We maintain an overweight risk stance in the Global Tactical Allocation Model relative to benchmark, favoring equities over fixed income, overweighting emerging markets, cyclical sectors, and factors (value, small/mid-caps). We overweight credit risk through high yield, loans, and emerging markets debt relative to investment grade credit, and stay neutral on duration. We remain underweight the US dollar (Figure 4, 5, 6, 7).
In particular:
- Within equities we overweight cyclical factors with high operating leverage such as value and (small) size, while we underweight defensive factors as low volatility and quality. We underweight momentum as inflection points in the market cycle tend to generate reversal effects between recent winners and losers. Similarly, we favor exposures to cyclical sectors such as financials, industrials, materials, and energy at the expense of health care, staples, utilities, and technology. From a regional perspective, we overweight emerging markets and developed ex-US equities, supported by improving risk appetite, expectations for US dollar depreciation, and confirmation of improving economic momentum in Europe.
- In fixed income we overweight risky credit via high yield, bank loans and emerging markets hard currency debt, given above average spreads and improving risk appetite. In this environment of below trend and improving growth, risky credit offers an attractive tactical opportunity for equity-like returns with lower volatility. The exposure is funded from investment grade and government bonds, while we maintain a neutral duration stance relative to benchmark. We expect additional compression in breakeven inflation expectations as inflation momentum continues to slow, hence favor nominal over inflation-linked bonds.
- In currency markets we remain underweight the US dollar, as global growth is outperforming relative to expectations and recovery regimes are typically accompanied by strong reflationary flows into non-US assets. While yield differentials still support the US dollar relative to foreign currencies, expensive valuations provide headwind to the greenback when safe-haven flows are abating. Within developed markets we favor the euro, the British pound, Norwegian kroner and Swedish krona relative to the Swiss Franc, Japanese yen, Australian and Canadian dollars. In EM we favor high yielders with attractive valuations as the Colombian peso and Brazilian real, relative to low yielding currencies as the Korean won, Taiwan dollar and Chinese renminbi.

Source: Invesco Investment Solutions, Dec. 31, 2022. DM = developed markets. EM = emerging markets. Non-USD FX refers to foreign exchange exposure as represented by the currency composition of the MSCI ACWI Index.
For illustrative purposes only.

Source: Invesco Investment Solutions, Dec. 31, 2022. For illustrative purposes only. Neutral refers to an equally weighted factor portfolio.

Source: Invesco Investment Solutions, Dec. 31, 2022. For illustrative purposes only. Sector allocations derived from factor and style allocations based on proprietary sector classification methodology. As of November 30th, 2022, Cyclicals: energy, financials, industrials, materials; Defensives: consumer staples, health care, information technology, real estate, communication services, utilities; Neutral: consumer discretionary.

Source: Invesco Investment Solutions, Dec. 31, 2022. For illustrative purposes only. Currency allocation process considers four drivers of foreign exchange markets: 1) US monetary policy relative to the rest of the world, 2) global growth relative to consensus expectations, 3) currency yields (i.e., carry), 4) currency long-term valuations.
当資料ご利用上のご注意
当資料は情報提供を目的として、インベスコ・アセット・マネジメント株式会社(以下、「当社」)のグループに属する運用プロフェッショナルが英文で作成したものであり、法令に基づく開示書類でも金融商品取引契約の締結の勧誘資料でもありません。内容には正確を期していますが、必ずしも完全性を当社が保証するものではありません。また、当資料は信頼できる情報に基づいて作成されたものですが、その情報の確実性あるいは完結性を表明するものではありません。当資料に記載されている内容は既に変更されている場合があり、また、予告なく変更される場合があります。当資料には将来の市場の見通し等に関する記述が含まれている場合がありますが、それらは資料作成時における作成者の見解であり、将来の動向や成果を保証するものではありません。また、当資料に示す見解は、インベスコの他の運用チームの見解と異なる場合があります。過去のパフォーマンスや動向は将来の収益や成果を保証するものではありません。当社の事前の承認なく、当資料の一部または全部を使用、複製、転用、配布等することを禁じます。
受託資産の運用に係るリスクについて
受託資産の運用にはリスクが伴い、場合によっては元本に損失が生じる可能性があります。各受託資産へご投資された場合、各受託資産は価格変動を伴う有価証券に投資するため、投資リスク(株価の変動リスク、株価指数先物の価格変動リスク、公社債にかかるリスク、債券先物の価格変動リスク、コモディティにかかるリスク、信用リスク、デフォルト・リスク、流動性リスク、カントリー・リスク、為替変動リスク、中小型株式への投資リスク、デリバティブ.金融派生商品.に関するリスク等)による損失が生じるおそれがあります。ご投資の際には、各受託資産の契約締結前書面、信託約款、商品説明書、目論見書等を必ずご確認下さい。
受託資産の運用に係る費用等について
投資一任契約に関しては、次の事項にご留意ください。【投資一任契約に係る報酬】直接投資の場合の投資一任契約に係る報酬は契約資産額に対して年率0.88%(税込)を上限とする料率を乗じた金額、投資先ファンドを組み入れる場合の投資一任契約に係る報酬は契約資産額に対して年率0.605%(税込)を上限とする料率を乗じた金額が契約期間に応じてそれぞれかかります。また、投資先外国籍ファンドの運用報酬については契約資産額に対して年率1.30%を上限とする料率を乗じた金額が契約期間に応じてかかります。一部の受託資産では投資一任契約に加えて成功報酬がかかる場合があります。成功報酬については、運用戦略および運用状況などによって変動するものであり、事前に料率、上限額などを表示することができません。【特定(金銭)信託の管理報酬】当該信託口座の受託銀行である信託銀行に管理報酬をお支払いいただく必要があります。具体的料率については信託銀行にご確認下さい。【組入有価証券の売買時に発生する売買委託手数料等】当該費用については、運用状況や取引量等により変動するものであり、事前に具体的な料率、金額、上限または計算方法等を示すことができません。【費用合計額】上記の費用の合計額については、運用状況などによって変動するものであり、事前に料率、上限額などを表示することができません。
20230111-2673515-JP
そのほかの投資関連情報はこちらをご覧ください。https://www.invesco.com/jp/ja/institutional/insights.html

